
Compare Abans Financial with Similar Stocks
Stock DNA
Holding Company
INR 1,021 Cr (Micro Cap)
11.00
20
0.00%
0.60
7.71%
0.82
Total Returns (Price + Dividend) 
Abans Financial for the last several years.
Risk Adjusted Returns v/s
Returns Beta

News

Abans Financial Services Ltd is Rated Sell
Abans Financial Services Ltd is rated 'Sell' by MarketsMOJO, with this rating last updated on 16 May 2026. However, the analysis and financial metrics discussed here reflect the stock's current position as of 08 June 2026, providing investors with an up-to-date view of the company’s fundamentals, valuation, financial trends, and technical outlook.
Read full news article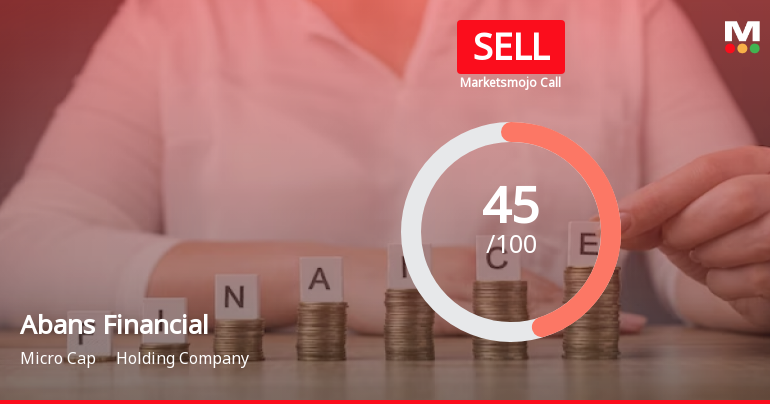
Abans Financial Services Ltd is Rated Sell
Abans Financial Services Ltd is rated Sell by MarketsMOJO, with this rating last updated on 16 May 2026. However, the analysis and financial metrics discussed here reflect the stock’s current position as of 08 June 2026, providing investors with the most up-to-date view of the company’s fundamentals, returns, and technical outlook.
Read full news article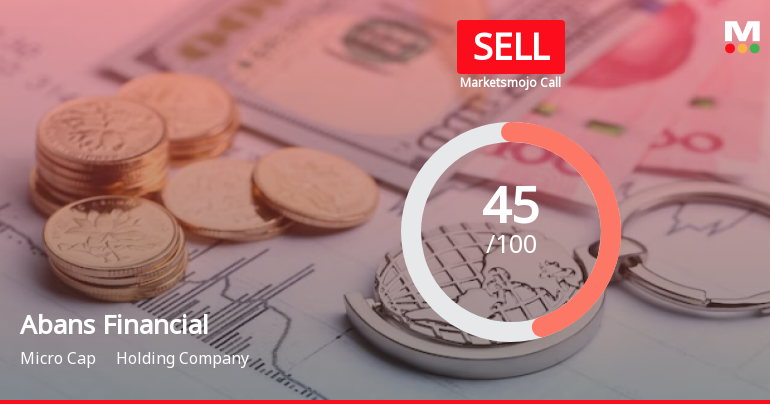
Abans Financial Services Ltd is Rated Sell
Abans Financial Services Ltd is rated Sell by MarketsMOJO. This rating was last updated on 16 May 2026. However, all fundamentals, returns, and financial metrics discussed here reflect the stock's current position as of 25 May 2026, providing investors with the latest insights into the company’s performance and outlook.
Read full news article Announcements
Announcement under Regulation 30 (LODR)-Award_of_Order_Receipt_of_Order
04-Jun-2026 | Source : BSEIntimation for receipt of Order from International Financial Services Centres Authority by Abans Financial Services Limited (IFSC Branch)
Announcement under Regulation 30 (LODR)-Newspaper Publication
02-Jun-2026 | Source : BSESpecial Window for Transfer and Dematerialisation of Physical Securities
Announcement under Regulation 30 (LODR)-Change in Management
21-May-2026 | Source : BSEIntimation of Resignation of Senior Management Personnel
Corporate Actions

No Upcoming Board Meetings

No Dividend history available

No Splits history available

No Bonus history available

No Rights history available
Quality key factors
Valuation key factors
Technicals key factors
 Technical Indicator Scale: Bearish, Mildly Bearish, Sideways, Mildly Bullish, Bullish Turned
 Shareholding Snapshot : Mar 2026
Shareholding Compare (%holding)
Promoters
None
Held by 0 Schemes
Held by 18 FIIs (19.02%)
Abhishek P Bansal (70.47%)
Resonance Opportunities Fund (4.88%)
4.82%
Quarterly Results Snapshot (Consolidated) - Mar'26 - QoQ

QoQ Growth in quarter ended Mar 2026 is 34.08% vs -4.93% in Dec 2025

QoQ Growth in quarter ended Mar 2026 is -112.07% vs -16.05% in Dec 2025
Half Yearly Results Snapshot (Consolidated) - Sep'25
Growth in half year ended Sep 2025 is 830.84% vs 51.01% in Sep 2024
Growth in half year ended Sep 2025 is 43.09% vs 17.23% in Sep 2024
Nine Monthly Results Snapshot (Consolidated) - Dec'25
YoY Growth in nine months ended Dec 2025 is 586.36% vs 96.77% in Dec 2024
YoY Growth in nine months ended Dec 2025 is 36.22% vs 18.13% in Dec 2024
Annual Results Snapshot (Consolidated) - Mar'26
YoY Growth in year ended Mar 2026 is 627.70% vs 137.75% in Mar 2025
YoY Growth in year ended Mar 2026 is -5.49% vs 24.65% in Mar 2025
About Abans Financial Services Ltd

Company Coordinates


