
Compare Abate As Indust with Similar Stocks
Total Returns (Price + Dividend) 
Abate As Indust for the last several years.
Risk Adjusted Returns v/s
Returns Beta

News
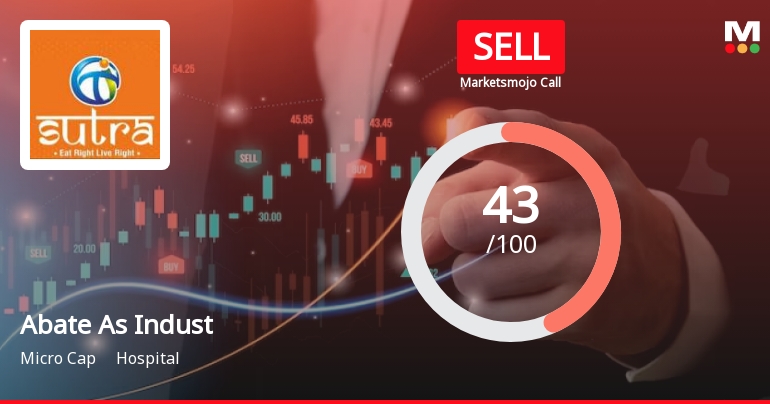
Abate As Industries Ltd is Rated Sell
Abate As Industries Ltd is rated 'Sell' by MarketsMOJO, with this rating last updated on 27 May 2026. However, the analysis and financial metrics discussed here reflect the stock’s current position as of 12 June 2026, providing investors with the latest insights into the company’s performance and outlook.
Read full news article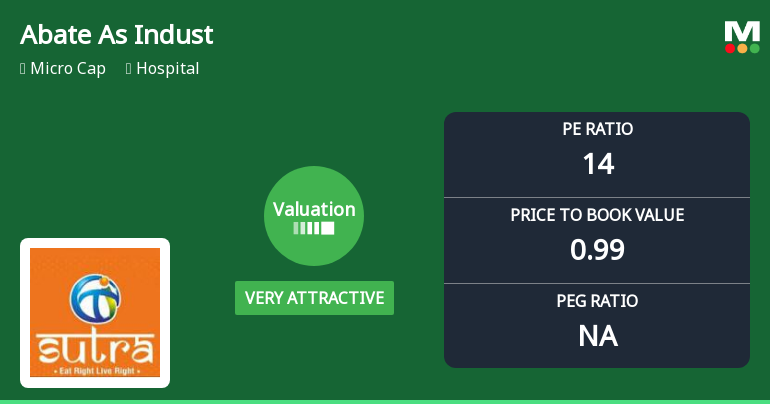
Abate As Industries Ltd Valuation Shifts to Very Attractive Amid Market Volatility
Abate As Industries Ltd, a micro-cap player in the hospital sector, has witnessed a significant shift in its valuation parameters, moving from a very expensive to a very attractive price range. This change is underscored by a notable improvement in its price-to-earnings (P/E) and price-to-book value (P/BV) ratios, positioning the stock as a compelling consideration for investors seeking value in a volatile market environment.
Read full news article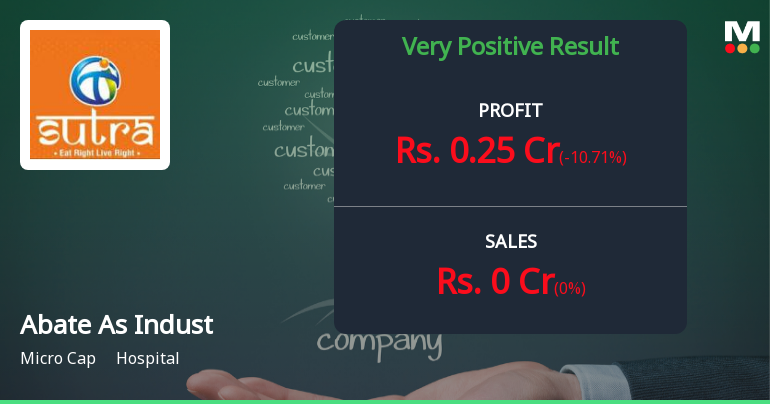
Abate As Industries Q4 FY26: Profit Surge Masks Valuation Concerns
Abate As Industries Ltd., a micro-cap hospital operator with a market capitalisation of ₹158.00 crores, reported a consolidated net profit of ₹2.93 crores for Q4 FY26, marking a remarkable 146.22% year-on-year surge from ₹1.19 crores in Q4 FY25. However, the quarter-on-quarter performance revealed a 4.25% decline from ₹3.06 crores in Q3 FY26, signalling potential momentum challenges. The stock, trading at ₹10.39 as of May 29, 2026, has delivered a modest 2.87% gain in the latest trading session but remains deeply underwater on a year-to-date basis, down 40.63%.
Read full news article Announcements
Response To BSE Query Regarding Auditors Report.
11-Jun-2026 | Source : BSESubmission of detailed Independent Auditors Report in response to BSE query dated 11th June 2026.
Announcement under Regulation 30 (LODR)-Earnings Call Transcript
04-Jun-2026 | Source : BSEAnnouncement under Regulation 30 (LODR)- Earning Call Transcript
Announcement under Regulation 30 (LODR)-Newspaper Publication
01-Jun-2026 | Source : BSESubmission of Newspaper Publication of Standalone and Consolidated Financial Results for the Quarter and Year Ended 31st March 2026.
Corporate Actions

No Upcoming Board Meetings

No Dividend history available

No Splits history available

Abate As Industries Ltd has announced 1:1 bonus issue, ex-date: 31 Jul 25

No Rights history available
Quality key factors
Valuation key factors
Technicals key factors
 Technical Indicator Scale: Bearish, Mildly Bearish, Sideways, Mildly Bullish, Bullish Turned
 Shareholding Snapshot : Mar 2026
Shareholding Compare (%holding)
Non Institution
None
Held by 0 Schemes
Held by 0 FIIs
Halik Musthafa K . (4.81%)
Shireen M T (14.62%)
13.87%
Quarterly Results Snapshot (Standalone) - Mar'26 - QoQ
QoQ Growth in quarter ended Mar 2026 is 0.00% vs 0.00% in Dec 2025

QoQ Growth in quarter ended Mar 2026 is -10.71% vs -66.67% in Dec 2025
Half Yearly Results Snapshot (Standalone) - Sep'25
Growth in half year ended Sep 2025 is 0.00% vs 0.00% in Sep 2024
Growth in half year ended Sep 2025 is 1,733.33% vs 40.00% in Sep 2024
Nine Monthly Results Snapshot (Standalone) - Dec'25
YoY Growth in nine months ended Dec 2025 is 0.00% vs 0.00% in Dec 2024
YoY Growth in nine months ended Dec 2025 is 3,250.00% vs 66.67% in Dec 2024
Annual Results Snapshot (Standalone) - Mar'26
YoY Growth in year ended Mar 2026 is 0.00% vs 0.00% in Mar 2025
YoY Growth in year ended Mar 2026 is 187.04% vs 159.34% in Mar 2025
About Abate As Industries Ltd

Company Coordinates


