
Compare ABC India with Similar Stocks
Dashboard
With a Operating Losses, the company has a Weak Long Term Fundamental Strength
- Company's ability to service its debt is weak with a poor EBIT to Interest (avg) ratio of 1.04
- The company has been able to generate a Return on Equity (avg) of 5.12% signifying low profitability per unit of shareholders funds
Flat results in Mar 26
Risky - Negative EBITDA
Consistent Underperformance against the benchmark over the last 3 years
Stock DNA
Transport Services
INR 36 Cr (Micro Cap)
NA (Loss Making)
37
0.76%
-0.07
-3.11%
0.62
Total Returns (Price + Dividend) 
Latest dividend: 0.5 per share ex-dividend date: Sep-12-2025
Risk Adjusted Returns v/s
Returns Beta

News

ABC India Ltd is Rated Strong Sell
ABC India Ltd is rated Strong Sell by MarketsMOJO. This rating was last updated on 16 December 2024. However, the analysis and financial metrics discussed below reflect the company’s current position as of 18 June 2026, providing investors with an up-to-date view of the stock’s fundamentals, valuation, financial trend, and technical outlook.
Read full news articleAre ABC India Ltd latest results good or bad?
ABC India Ltd's latest financial results for Q4 FY26 reveal a complex operational landscape. The company reported a net profit of ₹2.22 crore, which reflects a significant sequential increase compared to the previous quarter, attributed largely to extraordinary items rather than core operational improvements. However, the revenue for the quarter was ₹45.20 crore, indicating a year-on-year decline of 7.02%, marking the third consecutive quarter of negative revenue growth when compared to the same period last year. The operating margin for the quarter stood at -1.37%, which, while showing a slight improvement from the previous quarter's -1.83%, remains deeply negative and raises concerns about the company's ability to generate sustainable profits from its core operations. The persistent negative operating margins highlight ongoing operational challenges, with the company struggling to maintain profitability ...
Read full news article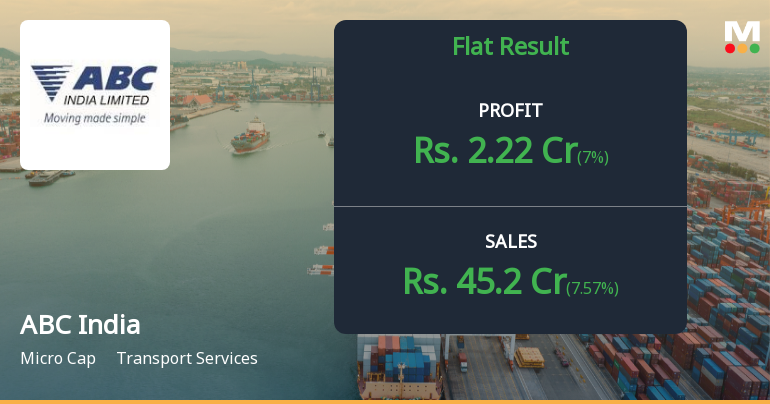
ABC India Q4 FY26: Losses Deepen as Transport Services Provider Struggles with Margin Erosion
ABC India Ltd., a Kolkata-based freight and logistics services provider, reported a net profit of ₹2.22 crores in Q4 FY26 (quarter ending March 2026), marking an extraordinary surge from ₹0.03 crores in the previous quarter. However, this dramatic improvement masks deeper operational challenges, as the company continues to grapple with negative operating margins and declining revenues. The stock, currently trading at ₹65.00 with a micro-cap market capitalisation of ₹35.00 crores, has underperformed the broader market significantly, losing 26.14% over the past year whilst the Sensex declined just 6.98%.
Read full news article Announcements
Closure of Trading Window
23-Jun-2026 | Source : BSEClosure of Trading Window for the quarter ended 30th June 2026.
Announcement under Regulation 30 (LODR)-Newspaper Publication
02-Jun-2026 | Source : BSESpecial Window for Transfer and Dematerialisation of Physical Securities
Announcement under Regulation 30 (LODR)-Newspaper Publication
28-May-2026 | Source : BSENewspaper Publication of Audited Financial Results of the Company for the quarter and year ended 31st March 2026
Corporate Actions

No Upcoming Board Meetings

ABC India Ltd has declared 5% dividend, ex-date: 12 Sep 25

No Splits history available

No Bonus history available

No Rights history available
Quality key factors
Valuation key factors
Technicals key factors
 Technical Indicator Scale: Bearish, Mildly Bearish, Sideways, Mildly Bullish, Bullish Turned
 Shareholding Snapshot : Mar 2026
Shareholding Compare (%holding)
Promoters
None
Held by 1 Schemes (0.0%)
Held by 0 FIIs
Abc Financial Services Private Limited (36.77%)
Sanjiv Dhireshbhai Shah (3.37%)
25.96%
Quarterly Results Snapshot (Standalone) - Mar'26 - QoQ

QoQ Growth in quarter ended Mar 2026 is 7.57% vs 7.91% in Dec 2025

QoQ Growth in quarter ended Mar 2026 is 7,300.00% vs -25.00% in Dec 2025
Half Yearly Results Snapshot (Standalone) - Sep'25
Growth in half year ended Sep 2025 is -11.83% vs 5.82% in Sep 2024
Growth in half year ended Sep 2025 is -96.45% vs 15.75% in Sep 2024
Nine Monthly Results Snapshot (Standalone) - Dec'25
YoY Growth in nine months ended Dec 2025 is -12.84% vs 9.15% in Dec 2024
YoY Growth in nine months ended Dec 2025 is -95.96% vs 5.19% in Dec 2024
Annual Results Snapshot (Standalone) - Mar'26
YoY Growth in year ended Mar 2026 is -11.31% vs 12.37% in Mar 2025
YoY Growth in year ended Mar 2026 is -6.48% vs 8.33% in Mar 2025
About ABC India Ltd

Company Coordinates


