
Compare Abhinav Capital with Similar Stocks
Stock DNA
Non Banking Financial Company (NBFC)
INR 75 Cr (Micro Cap)
29.00
21
0.00%
0.00
3.36%
0.93
Total Returns (Price + Dividend) 
Abhinav Capital for the last several years.
Risk Adjusted Returns v/s
Returns Beta

News
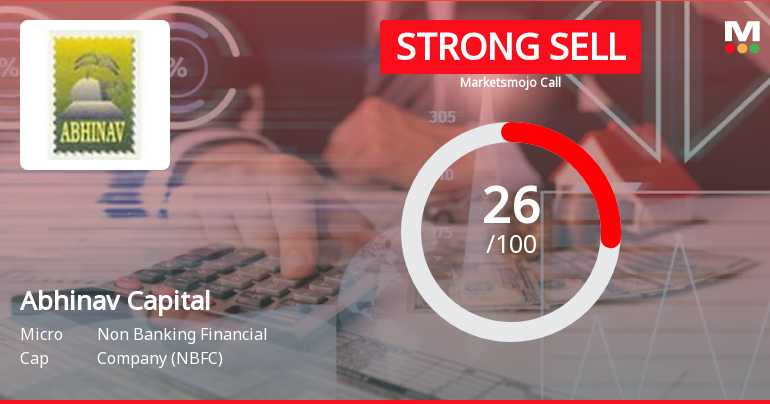
Abhinav Capital Services Ltd is Rated Strong Sell
Abhinav Capital Services Ltd is rated Strong Sell by MarketsMOJO. This rating was last updated on 23 October 2025. However, the analysis and financial metrics discussed below reflect the stock’s current position as of 09 July 2026, providing investors with the latest insights into the company’s performance and outlook.
Read full news article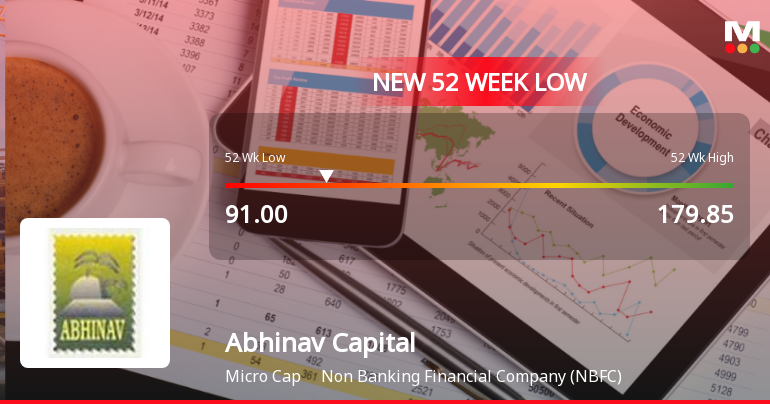
Abhinav Capital Services Ltd Falls to 52-Week Low of Rs 91 as Sell-Off Deepens
After six consecutive sessions of decline, Abhinav Capital Services Ltd hit a fresh 52-week low of Rs 91 on 3 Jul 2026, marking a significant 49.4% drop from its 52-week high of Rs 179.85. This downturn comes despite a volatile intraday session where the stock briefly rallied to Rs 108.45 before retreating sharply.
Read full news article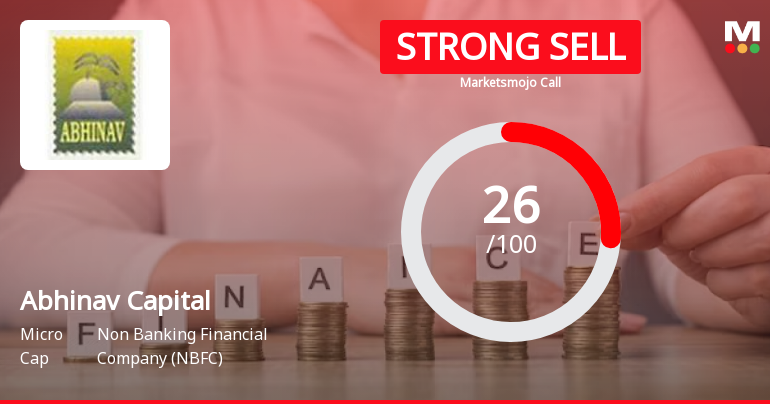
Abhinav Capital Services Ltd is Rated Strong Sell
Abhinav Capital Services Ltd is rated Strong Sell by MarketsMOJO, with this rating last updated on 23 Oct 2025. However, the analysis and financial metrics discussed here reflect the stock’s current position as of 28 June 2026, providing investors with the latest insights into its performance and outlook.
Read full news article Announcements
Compliances-Certificate under Reg. 74 (5) of SEBI (DP) Regulations 2018
07-Jul-2026 | Source : BSEConfirmation Certificate in the matter of Regulation 74(5) of SEBI (DP) Regulations 2018
Closure of Trading Window
25-Jun-2026 | Source : BSEPursuant to Companys Code of Conduct for regulating monitoring & reporting trading in securities the Trading Window for trading in shares of the Company shall remain closed for Designated Persons from 1st July 2026 till 48 hours after declaration of the Financial Results of the Company for the quarter ended 30th June 2026.
Compliances-Reg.24(A)-Annual Secretarial Compliance
18-May-2026 | Source : BSEPlease find enclosed herewith Annual Secretarial Compliance Report of the Company pursaunt to Regulation 24A of the SEBI (LODR) Regulations 2015 issued by M/s. D G Prajapati & Associates Practicing Company Secretary for the year ended 31st March 2026 Please take the above information on record.
Corporate Actions

No Upcoming Board Meetings

No Dividend history available

No Splits history available

No Bonus history available

No Rights history available
Quality key factors
Valuation key factors
Technicals key factors
 Technical Indicator Scale: Bearish, Mildly Bearish, Sideways, Mildly Bullish, Bullish Turned
 Shareholding Snapshot : Mar 2026
Shareholding Compare (%holding)
Promoters
None
Held by 0 Schemes
Held by 0 FIIs
Kailash Hardattrai Biyani (20.22%)
Aqua Proof Wall Plast Private Limited (8.15%)
5.07%
Quarterly Results Snapshot (Standalone) - Mar'26 - QoQ

QoQ Growth in quarter ended Mar 2026 is -3.51% vs 6.54% in Dec 2025

QoQ Growth in quarter ended Mar 2026 is 21.31% vs -19.74% in Dec 2025
Half Yearly Results Snapshot (Standalone) - Sep'25
Growth in half year ended Sep 2025 is -58.08% vs -49.22% in Sep 2024
Growth in half year ended Sep 2025 is -36.41% vs -71.45% in Sep 2024
Nine Monthly Results Snapshot (Standalone) - Dec'25
YoY Growth in nine months ended Dec 2025 is -48.13% vs -52.62% in Dec 2024
YoY Growth in nine months ended Dec 2025 is -22.27% vs -71.83% in Dec 2024
Annual Results Snapshot (Standalone) - Mar'26
YoY Growth in year ended Mar 2026 is -21.90% vs -64.16% in Mar 2025
YoY Growth in year ended Mar 2026 is 114.05% vs -86.93% in Mar 2025
About Abhinav Capital Services Ltd

Company Coordinates


