
Compare Academy Sports & Outdoors, Inc. with Similar Stocks
Dashboard
High Management Efficiency with a high ROCE of 35.63%
Strong ability to service debt as the company has a low Debt to EBITDA ratio of 0.39 times
Healthy long term growth as Operating profit has grown by an annual rate 10.61%
Flat results in Jul 25
With ROCE of 23.26%, it has a attractive valuation with a 1.38 Enterprise value to Capital Employed
Consistent Underperformance against the benchmark over the last 3 years
Total Returns (Price + Dividend) 
Academy Sports & Outdoors, Inc. for the last several years.
Risk Adjusted Returns v/s
News
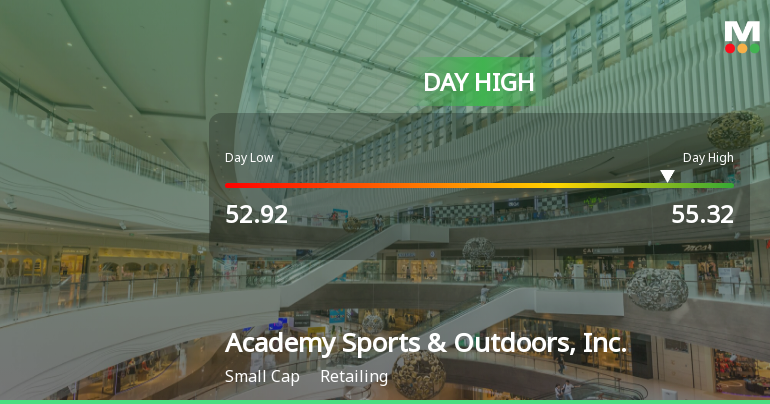
Academy Sports & Outdoors Hits Day High with 12.59% Surge
Academy Sports & Outdoors, Inc. saw a significant stock increase today, contrasting with a slight decline in the S&P 500. The company has shown strong management efficiency, a low debt-to-EBITDA ratio, and healthy long-term growth potential, despite a challenging year-to-date performance. Its market capitalization stands at USD 3,363 million.
Read full news article
Academy Sports & Outdoors Stock Opens with 9.03% Gain, Marking Significant Gap Up
Academy Sports & Outdoors, Inc. experienced a significant stock increase, outperforming the S&P 500. The company has shown strong monthly growth, though technical indicators present mixed signals. Despite a decline in net profit and annual returns, it maintains a favorable valuation and strong management efficiency metrics.
Read full news article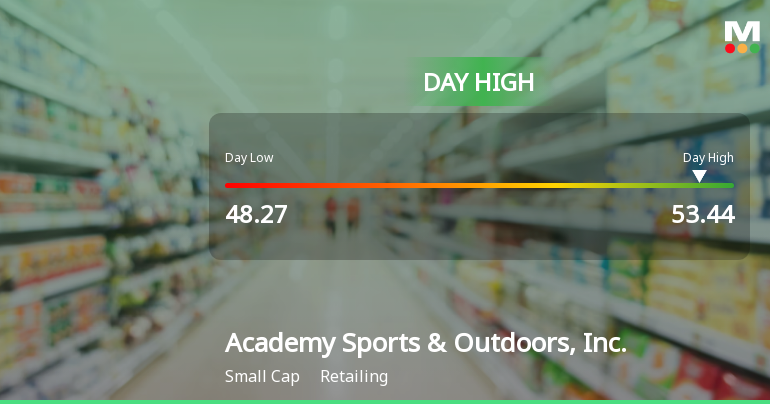
Academy Sports & Outdoors Stock Hits Day High with 8.64% Surge
Academy Sports & Outdoors, Inc. has seen a notable rise in stock performance, particularly on December 9, 2025. The company has outperformed the S&P 500 in various time frames, demonstrating strong management efficiency and a solid ability to service debt, while navigating challenges in longer-term performance.
Read full news article Announcements

Corporate Actions
Quality key factors
Valuation key factors
Technicals key factors
 Technical Indicator Scale: Bearish, Mildly Bearish, Sideways, Mildly Bullish, Bullish Turned
 Shareholding Snapshot : Oct 2025
Shareholding Compare (%holding)
Domestic Funds
Held in 108 Schemes (69.94%)
Held by 138 Foreign Institutions (8.46%)
Quarterly Results Snapshot (Consolidated) - Oct'25 - YoY

YoY Growth in quarter ended Oct 2025 is 3.01% vs -3.90% in Oct 2024
YoY Growth in quarter ended Oct 2025 is 8.81% vs -34.20% in Oct 2024
Annual Results Snapshot (Consolidated) - Jan'25
YoY Growth in year ended Jan 2025 is -3.67% vs -3.69% in Jan 2024

YoY Growth in year ended Jan 2025 is -19.41% vs -17.32% in Jan 2024
About Academy Sports & Outdoors, Inc.

Company Coordinates


