
Compare Ace Integrated with Similar Stocks
Dashboard
With a Operating Losses, the company has a Weak Long Term Fundamental Strength
- Poor long term growth as Net Sales has grown by an annual rate of -51.08% and Operating profit at -207.14% over the last 5 years
- Company's ability to service its debt is weak with a poor EBIT to Interest (avg) ratio of -1.30
Flat results in Sep 25
Risky - Negative EBITDA
Below par performance in long term as well as near term
Stock DNA
Commercial Services & Supplies
INR 21 Cr (Micro Cap)
NA (Loss Making)
22
0.00%
-0.17
-8.84%
1.22
Total Returns (Price + Dividend) 
Ace Integrated for the last several years.
Risk Adjusted Returns v/s
Returns Beta

News
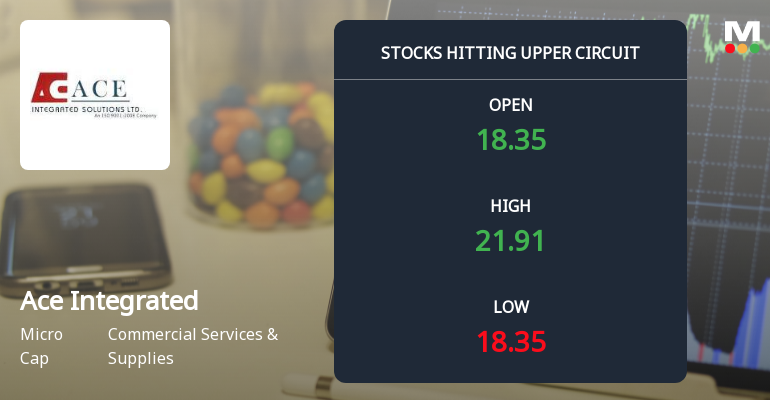
Ace Integrated Solutions Ltd Locks at Upper Circuit With 15.83% Gain — Buyers Queue, Sellers Absent
At Rs 21.91, the buying was done — not because demand dried up, but because the exchange wouldn't let the stock go any higher. Ace Integrated Solutions Ltd locked at its upper circuit of 15.83% on 21 Apr 2026, with buyers queuing and no sellers willing to part with shares.
Read full news article Announcements
Ace Integrated Solutions Limited - Financial Results Updates
14-Nov-2019 | Source : NSEAce Integrated Solutions Limited has informed the Exchange regardingá Un-audited Financial results of the Company for the half year ended September 30, 2019.
Ace Integrated Solutions Limited - Updates
08-Nov-2019 | Source : NSEAce Integrated Solutions Limited has informed the Exchange regarding 'Legal cases of the Company'.
Ace Integrated Solutions Limited - Trading Window
22-Oct-2019 | Source : NSEAce Integrated Solutions Limited has informed the Exchange regarding the Trading Window closure pursuant to SEBI (Prohibition of Insider Trading) Regulations, 2015
Corporate Actions

No Upcoming Board Meetings

No Dividend history available

No Splits history available

Ace Integrated Solutions Ltd has announced 1:2 bonus issue, ex-date: 07 Oct 21

No Rights history available
Quality key factors
Valuation key factors
Technicals key factors
 Technical Indicator Scale: Bearish, Mildly Bearish, Sideways, Mildly Bullish, Bullish Turned
 Shareholding Snapshot : Mar 2026
Shareholding Compare (%holding)
Promoters
None
Held by 0 Schemes
Held by 0 FIIs
Chandra Shekhar Verma (41.18%)
Shorya Mercantile Private Limited (3.18%)
17.19%
Quarterly Results Snapshot (Standalone) - Mar'26 - YoY

YoY Growth in quarter ended Mar 2026 is -93.75% vs -56.63% in Mar 2025

YoY Growth in quarter ended Mar 2026 is 75.36% vs -286.49% in Mar 2025
Half Yearly Results Snapshot (Standalone) - Sep'25
Growth in half year ended Sep 2025 is -89.26% vs 64.64% in Sep 2024
Growth in half year ended Sep 2025 is -950.00% vs 125.00% in Sep 2024
Nine Monthly Results Snapshot (Standalone) - Dec'25
YoY Growth in nine months ended Dec 2025 is -89.87% vs 22.16% in Dec 2024
YoY Growth in nine months ended Dec 2025 is -258.82% vs 46.88% in Dec 2024
Annual Results Snapshot (Standalone) - Mar'26
YoY Growth in year ended Mar 2026 is -90.53% vs -6.46% in Mar 2025
YoY Growth in year ended Mar 2026 is 39.10% vs -480.49% in Mar 2025
About Ace Integrated Solutions Ltd

Company Coordinates


