
Compare Achyut Healthcar with Similar Stocks
Dashboard
Poor Management Efficiency with a low ROE of 1.27%
- The company has been able to generate a Return on Equity (avg) of 1.27% signifying low profitability per unit of shareholders funds
The company is Net-Debt Free
Flat results in Mar 26
With ROE of 0.9, it has a Very Expensive valuation with a 5.8 Price to Book Value
Majority shareholders : Non Institution
Market Beating performance in long term as well as near term
Stock DNA
Pharmaceuticals & Biotechnology
INR 235 Cr (Micro Cap)
673.00
23
0.00%
-0.09
0.91%
6.28
Total Returns (Price + Dividend) 
Achyut Healthcar for the last several years.
Risk Adjusted Returns v/s
Returns Beta

News
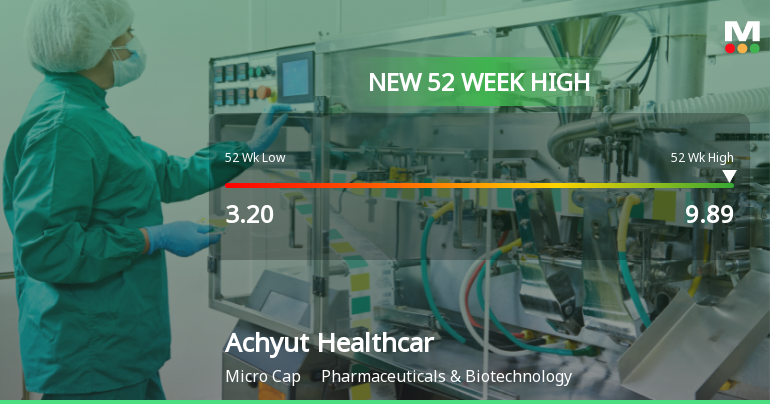
Broad-Based Technical Strength Lifts Achyut Healthcare Ltd to 52-Week High of Rs 9.89
Achyut Healthcare Ltd has surged to a new 52-week high of Rs 9.89 on 24 Jun 2026, marking a remarkable rally that has seen the stock gain 48.46% over the past eight consecutive trading days. This momentum has propelled the micro-cap pharmaceutical player to nearly triple its value from the 52-week low of Rs 3.20, significantly outperforming the Sensex, which has declined 6.85% over the same period.
Read full news article
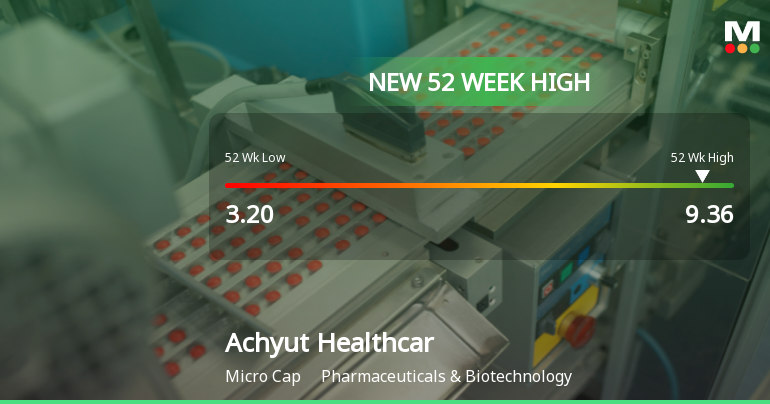
Broad-Based Technical Strength Lifts Achyut Healthcare Ltd to 52-Week High of Rs 9.36
Surging past its previous peaks, Achyut Healthcare Ltd touched a fresh 52-week high of Rs 9.36 on 23 Jun 2026, marking a remarkable rally from its low of Rs 3.20 just a year ago. This impressive 181.25% gain has been fuelled by a confluence of strong technical signals and sustained price momentum, setting the stock apart in the Pharmaceuticals & Biotechnology sector.
Read full news article Announcements
Announcement under Regulation 30 (LODR)-Newspaper Publication
28-May-2026 | Source : BSEPaper Cutting of Published Audited Financial Result for the Quarter and Year ended 31st March 2026
Submission Of Statement Of Deviation Or Variation For Proceeds Of Public Issue Pursuant To Regulation 32 Of The SEBI (Listing Obligation And Disclosure Requirements) Regulation 2015 For The Year Ended On 31St March 2026
27-May-2026 | Source : BSESubmission of Statement of Deviation or Variation for proceeds of public issue pursuant to Regulation 32 of the SEBI (Listing Obligation and Disclosure Requirements) Regulation 2015 for the year ended on 31st March 2026
Appointment Of Internal Auditor For The Financial Year 2026-27 Pursuant To Regulation 30 Of The SEBI (LODR) Regulations 2015.
27-May-2026 | Source : BSEAppointment of Internal Auditor for the Financial Year 2026-27 Pursuant to Regulation 30 of the SEBI (LODR) Regulation 2015.
Corporate Actions

No Upcoming Board Meetings

No Dividend history available

Achyut Healthcare Ltd has announced 1:10 stock split, ex-date: 10 Dec 24

Achyut Healthcare Ltd has announced 4:10 bonus issue, ex-date: 10 Dec 24

No Rights history available
Quality key factors
Valuation key factors
Technicals key factors
 Technical Indicator Scale: Bearish, Mildly Bearish, Sideways, Mildly Bullish, Bullish Turned
 Shareholding Snapshot : Mar 2026
Shareholding Compare (%holding)
Non Institution
None
Held by 0 Schemes
Held by 1 FIIs (5.13%)
Mahendra Chatrabhuj Raycha (11.01%)
Dharam Prakash Tripathi (15.87%)
42.84%
Quarterly Results Snapshot (Standalone) - Mar'26 - QoQ

QoQ Growth in quarter ended Mar 2026 is 179.62% vs -38.43% in Dec 2025
QoQ Growth in quarter ended Mar 2026 is 0.00% vs -100.00% in Dec 2025
Half Yearly Results Snapshot (Standalone) - Sep'25
Growth in half year ended Sep 2025 is 513.04% vs -56.81% in Mar 2025
Growth in half year ended Sep 2025 is 15.00% vs -42.86% in Mar 2025
Nine Monthly Results Snapshot (Standalone) - Dec'25

YoY Growth in nine months ended Dec 2025 is 10.58% vs 11.07% in Mar 2026
YoY Growth in nine months ended Dec 2025 is -43.90% vs 28.12% in Mar 2026
Annual Results Snapshot (Standalone) - Mar'26
YoY Growth in year ended Mar 2026 is 280.00% vs -50.33% in Mar 2025
YoY Growth in year ended Mar 2026 is -37.25% vs 2.00% in Mar 2025
About Achyut Healthcare Ltd

Company Coordinates


