
Compare Action Const.Eq. with Similar Stocks
Dashboard
Flat results in Mar 26
- ROCE(HY) Lowest at 28.67%
- DEBTORS TURNOVER RATIO(HY) Lowest at 11.54 times
- PAT(Q) At Rs 110.91 cr has Fallen at -6.5%
With ROE of 20.6, it has a Expensive valuation with a 6 Price to Book Value
Falling Participation by Institutional Investors
Underperformed the market in the last 1 year
Stock DNA
Automobiles
INR 12,113 Cr (Small Cap)
29.00
39
0.20%
-0.31
20.64%
5.99
Total Returns (Price + Dividend) 
Latest dividend: 1.9960398159049557 per share ex-dividend date: Aug-14-2025
Risk Adjusted Returns v/s
Returns Beta

News

Action Construction Equipment Ltd Shows Mixed Technical Signals Amid Sideways Momentum
Action Construction Equipment Ltd (NSE: 680359) has exhibited a notable shift in its technical momentum, transitioning from a mildly bearish stance to a sideways trend. Despite a modest day gain of 1.47%, the stock’s technical indicators present a complex picture, with weekly and monthly signals diverging and suggesting cautious optimism tempered by underlying bearish pressures.
Read full news article
Action Construction Equipment Ltd is Rated Sell
Action Construction Equipment Ltd is rated 'Sell' by MarketsMOJO, with this rating last updated on 17 Nov 2025. However, the analysis and financial metrics presented here reflect the stock's current position as of 13 June 2026, providing investors with an up-to-date view of the company's performance and outlook.
Read full news article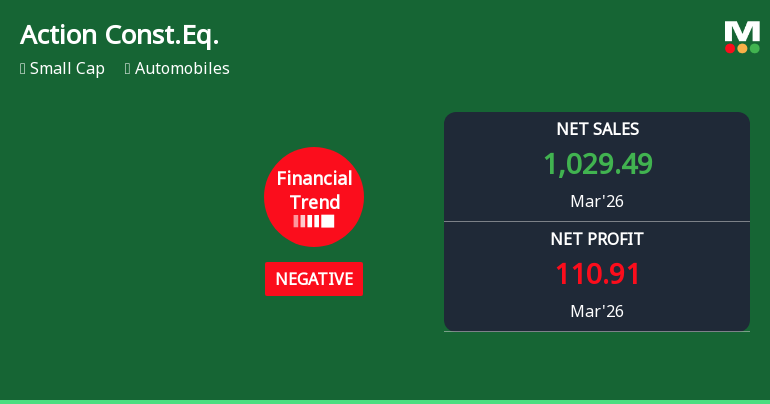
Action Construction Equipment Ltd Reports Mixed Quarterly Results Amid Negative Financial Trend
Action Construction Equipment Ltd (ACE), a key player in the Indian automobile sector, posted its quarterly results for March 2026, revealing a complex financial picture. While the company achieved record net sales and operating profits, key profitability metrics and efficiency ratios showed signs of strain, prompting a downgrade in its market rating to Strong Sell.
Read full news article Announcements
Announcement under Regulation 30 (LODR)-Analyst / Investor Meet - Intimation
12-Jun-2026 | Source : BSESchedule of Analyst/Investor meet is attached herewith.
Announcement under Regulation 30 (LODR)-Analyst / Investor Meet - Intimation
09-Jun-2026 | Source : BSESchedule of Analyst/Investor meet is attached herewith
Announcement under Regulation 30 (LODR)-Analyst / Investor Meet - Intimation
08-Jun-2026 | Source : BSESchedule of Analyst/Investor Meet is attached herewith.
Corporate Actions

No Upcoming Board Meetings

Action Construction Equipment Ltd has declared 100% dividend, ex-date: 14 Aug 25

Action Construction Equipment Ltd has announced 2:10 stock split, ex-date: 13 Mar 08

No Bonus history available

No Rights history available
Quality key factors
Valuation key factors
Technicals key factors
 Technical Indicator Scale: Bearish, Mildly Bearish, Sideways, Mildly Bullish, Bullish Turned
 Shareholding Snapshot : Mar 2026
Shareholding Compare (%holding)
Promoters
None
Held by 16 Schemes (0.55%)
Held by 135 FIIs (9.58%)
Mr. Vijay Agarwal (28.76%)
Massachusetts Institute Of Technolgy (1.84%)
19.03%
Quarterly Results Snapshot (Consolidated) - Mar'26 - YoY

YoY Growth in quarter ended Mar 2026 is 7.13% vs 14.97% in Mar 2025
YoY Growth in quarter ended Mar 2026 is -6.45% vs 20.44% in Mar 2025
Half Yearly Results Snapshot (Consolidated) - Sep'25
Growth in half year ended Sep 2025 is -6.35% vs 12.54% in Sep 2024
Growth in half year ended Sep 2025 is 4.91% vs 26.51% in Sep 2024
Nine Monthly Results Snapshot (Consolidated) - Dec'25
YoY Growth in nine months ended Dec 2025 is -4.87% vs 13.86% in Dec 2024
YoY Growth in nine months ended Dec 2025 is 4.65% vs 26.53% in Dec 2024
Annual Results Snapshot (Consolidated) - Mar'26
YoY Growth in year ended Mar 2026 is -1.40% vs 14.18% in Mar 2025
YoY Growth in year ended Mar 2026 is 1.43% vs 24.70% in Mar 2025
About Action Construction Equipment Ltd

Company Coordinates


