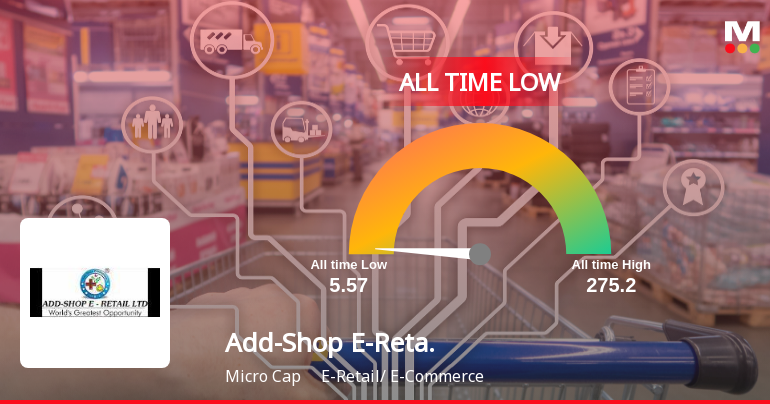
Add-Shop E-Reta.

  • Market Cap: Micro Cap
  • Industry: E-Retail/ E-Commerce
  • ISIN: INE01B501018
  • NSEID:
  • BSEID: 541865
INR
6.11
0.11 (1.83%)
BSENSE

Sep 01, 03:30 PM

BSE+NSE Vol: 33678

  • Price Points
  • Score
  • Mojo Parameters
  • Total Return
  • News and Corporate Actions
  • Key factors
  • Shareholding
  • Financials
  • CompanyCV
stock-summaryPrice Point
High/Low

1Day

52 Week

Valuation
Technical
Day's Volume

CASH

33.68 k (90.48%) Volume

Shareholding (Jun 2026)

FII

0.00%

Held by 0 FIIs

DII

0.00%

Held by 0 DIIs

Promoter

27.20%

Why is Add-Shop E-Retail Ltd falling/rising?

02-Sep-2026

As of 01-Sep, Add-Shop E-Retail Ltd's stock price is rising to 6.11, indicating a potential trend reversal after previous declines. However, its long-term performance is concerning, with significant drops in value and declining investor participation, suggesting the current rise may not be sustainable.

As of 01-Sep, Add-Shop E-Retail Ltd's stock price is rising, currently at 6.11, reflecting an increase of 0.11 or 1.83%. This upward movement is notable as it comes after two consecutive days of decline, indicating a potential trend reversal. Additionally, the stock has outperformed its sector by 3.49% today, suggesting a relative strength compared to its peers.<BR><BR>Despite the positive movement today, the stock has faced significant challenges over longer periods. Year-to-date, it has dropped by 31.58%, and over the past year, it has seen a decline of 38.78%. The stock's long-term performance is concerning, with an 83.46% decrease over the last three years, significantly underperforming the benchmark Sensex, which has gained 17.67% in the same timeframe.<BR><BR>Investor participation appears to be waning, as evidenced by a 70.94% drop in delivery volume on August 31 compared to the five-day average. This decline in trading activity may indicate a lack of confidence among investors, despite the stock's current rise.<BR><BR>Furthermore, while the stock is trading at a discount compared to its peers' historical valuations, it has also reported a significant profit decline of 52.7% over the past year. The weak long-term fundamental strength, characterized by a -28.07% compound annual growth rate in operating profits over the last five years, raises concerns about its sustainability.<BR><BR>In summary, while Add-Shop E-Retail Ltd is experiencing a short-term rise in stock price, the broader context of its long-term underperformance, declining investor participation, and weak fundamentals suggest that this upward movement may not be indicative of a lasting recovery.

View full answer

Who are in the management team of Add-Shop E-Reta.?

01-Sep-2026

The management team of Add-Shop E-Reta includes Dineshbhai Pandya (Managing Director), Jayshree Pandya (Director), Deviben Pandya and Devang Pandya (Executive Directors), along with several Independent Directors and Additional Directors overseeing company operations and strategy.

The management team of Add-Shop E-Reta includes the following individuals:<BR><BR>1. **Dineshbhai Pandya** - Managing Director<BR>2. **Jayshree Pandya** - Director<BR>3. **Deviben Pandya** - Executive Director<BR>4. **Devang Pandya** - Executive Director & CFO<BR>5. **Vivek Dadhania** - Independent Director<BR>6. **Rushabh Vora** - Independent Director<BR>7. **Yagnik Mundadiya** - Independent Director<BR>8. **Kinjal Khunt** - Independent Director<BR>9. **Shraddha Dev Pandya** - Additional Executive Director<BR>10. **Jaikishan Vasdev Wadhwani** - Additional Director<BR><BR>This team is responsible for overseeing the operations and strategic direction of the company.

View full answer

What does Add-Shop E-Reta. do?

01-Sep-2026

Add-Shop E-Retail Ltd is a Micro Cap company in the E-Retail/E-Commerce sector, reporting net sales of 46 Cr and a net profit of 0 Cr for June 2026. It was incorporated in 2013 and has undergone several name changes, with a current market cap of INR 17 Cr.

Overview:<BR>Add-Shop E-Retail Ltd operates in the E-Retail/E-Commerce industry and is classified as a Micro Cap company.<BR><BR>History:<BR>The company was originally incorporated as "Add-Shop Promotions Private Limited" in 2013. It transitioned to a Public Limited Company and changed its name to "Add-Shop Promotions Limited" in 2018, before adopting its current name, "Add-Shop E-Retail Limited," in 2020. The latest quarterly results reported net sales and net profit for June 2026.<BR><BR>Financial Snapshot:<BR>- Net Sales: 46 Cr (Quarterly Results - Jun 2026)<BR>- Net Profit: 0 Cr (Quarterly Results - Jun 2026)<BR>- Market Cap: INR 17 Cr (Micro Cap)<BR><BR>Key Metrics:<BR>- P/E: 15.00<BR>- Industry P/E: 21<BR>- Dividend Yield: 0.00%<BR>- Debt-Equity: 0.11<BR>- Return on Equity: 0.98%<BR>- Price to Book: 0.15<BR><BR>Contact Details:<BR>Address: B-304 Imperial Height, 150 ft Ring Road Rajkot Gujarat : 360005<BR>Tel: 91-281-2580499<BR>Email: investor@addshop.co<BR>Website: http://www.addshop.co

View full answer

Who are the peers of the Add-Shop E-Reta.?

01-Sep-2026

Peers of Add-Shop E-Reta. include JLA Infraville, Intrasoft Tech., Digidrive Dist., Jupiter Info., Pace E-Commerce, Ahasolar Technol, Olympia Industri, Fone4 Communica., and Finelistings Tec. Management risk varies from excellent at Intrasoft Tech. to below average for most peers, with Add-Shop E-Reta. showing average risk and a 1-year return of -39.82%.

Peers: The peers of Add-Shop E-Reta. are JLA Infraville, Intrasoft Tech., Digidrive Dist., Jupiter Info., Pace E-Commerce, Ahasolar Technol, Olympia Industri, Fone4 Communica., and Finelistings Tec.<BR><BR>Quality Snapshot: Excellent management risk is observed at Intrasoft Tech., while Average management risk is found at Add-Shop E-Reta. and Jupiter Info. Below Average management risk is noted for JLA Infraville, Digidrive Dist., Pace E-Commerce, Ahasolar Technol, Olympia Industri, Fone4 Communica., and Finelistings Tec. Growth is Excellent at Pace E-Commerce, Good at Intrasoft Tech. and Ahasolar Technol, Average at Jupiter Info. and Add-Shop E-Reta., and Below Average for JLA Infraville, Digidrive Dist., Olympia Industri, Fone4 Communica., and Finelistings Tec. Capital Structure is Good at Intrasoft Tech. and Add-Shop E-Reta., Average at Jupiter Info. and Pace E-Commerce, and Below Average for JLA Infraville, Digidrive Dist., Ahasolar Technol, Olympia Industri, Fone4 Communica., and Finelistings Tec.<BR><BR>Return Snapshot: The peer with the highest 1-year return is Intrasoft Tech. at -6.85%, while the lowest is Finelistings Tec at -62.60%. Add-Shop E-Reta.'s 1-year return of -39.82% is better than Finelistings Tec but worse than Intrasoft Tech. Additionally, several peers, including JLA Infraville, Digidrive Dist., Jupiter Info., Ahasolar Technol, Olympia Industri, Fone4 Communica., and Finelistings Tec, have negative six-month returns.

View full answer

How big is Add-Shop E-Reta.?

01-Sep-2026

As of 31st August, Add-Shop E-Retail Ltd has a market capitalization of 17.00 Cr and reported net sales of 170.88 Cr and a net profit of 1.12 Cr over the latest four quarters.

As of 31st August, <BR><BR>Market Cap: Add-Shop E-Retail Ltd has a market capitalization of 17.00 Cr, categorizing it as a Micro Cap company.<BR><BR>Recent Quarterly Performance: The sum of Net Sales for the latest 4 quarters is 170.88 Cr, while the sum of Net Profit for the same period is 1.12 Cr.<BR><BR>Balance Sheet Snapshot: The reporting period for the balance sheet is March 2025. Shareholder's Funds are valued at 112.85 Cr, and Total Assets amount to 155.47 Cr.

View full answer

Should I buy, sell or hold Add-Shop E-Retail Ltd?

19-Aug-2026

When is the next results date for Add-Shop E-Retail Ltd?

06-Aug-2026

The next results date for Add-Shop E-Retail Ltd is August 12, 2026.

The next results date for Add-Shop E-Retail Ltd is scheduled for August 12, 2026.

View full answer

Are Add-Shop E-Retail Ltd latest results good or bad?

23-May-2026

Add-Shop E-Retail Ltd's latest results show strong revenue growth of 63.53% sequentially and 14.60% year-on-year, but profitability remains a concern with flat net profit and declining margins. Overall, while revenue growth is positive, the lack of profit improvement raises questions about the company's operational efficiency and future sustainability.

Add-Shop E-Retail Ltd's latest results present a mixed picture. On one hand, the company achieved a remarkable sequential revenue growth of 63.53%, reaching ₹56.99 crores, which is the highest quarterly sales in its history. This growth also reflects a 14.60% increase year-on-year. However, this impressive topline growth did not translate into significant bottom-line improvement. The net profit for the quarter stood at ₹0.36 crores, which, while a 38.46% increase from the previous quarter, remained flat compared to the same quarter last year.<BR><BR>More concerning is the decline in profitability margins. The operating margin dropped to 1.70%, down from 2.30% in the previous quarter, indicating challenges in converting revenue growth into profit. Similarly, the profit after tax (PAT) margin decreased to 0.63%. <BR><BR>The market's reaction has been cautious, reflecting skepticism regarding the sustainability of Add-Shop E-Retail's business model in the competitive e-commerce landscape. The stock is currently trading significantly below its 52-week high, indicating investor concerns about its future performance.<BR><BR>In summary, while the revenue growth is a positive sign, the lack of corresponding profit growth and declining margins raise questions about the company's operational efficiency and long-term viability. Overall, the results can be seen as concerning, highlighting fundamental challenges that the company needs to address.

View full answer

How has been the historical performance of Add-Shop E-Reta.?

13-Nov-2025

Add-Shop E-Reta experienced fluctuating financial performance, with net sales declining from 203.06 Cr in Mar'24 to 155.13 Cr in Mar'25, alongside a decrease in operating profit and profit before tax, despite a slight increase in profit after tax and total assets. The company faced challenges with negative cash flow from operating activities, although financing activities showed positive inflow.

Answer:<BR>The historical performance of Add-Shop E-Reta shows a fluctuating trend in net sales and profitability over the years, with significant growth in earlier years followed by a decline in recent periods.<BR><BR>Breakdown:<BR>Add-Shop E-Reta's net sales peaked at 203.06 Cr in Mar'24 but fell to 155.13 Cr by Mar'25. The total operating income followed a similar pattern, decreasing from 203.06 Cr in Mar'24 to 155.13 Cr in Mar'25. The company's total expenditure also decreased from 195.48 Cr in Mar'24 to 148.84 Cr in Mar'25, contributing to an operating profit of 6.29 Cr in Mar'25, down from 7.58 Cr in Mar'24. Profit before tax also declined from 6.06 Cr in Mar'24 to 4.52 Cr in Mar'25, while profit after tax saw a slight increase from 3.16 Cr to 3.32 Cr during the same period. The company's total assets rose from 125.95 Cr in Mar'24 to 155.47 Cr in Mar'25, with total liabilities increasing from 12.77 Cr to 37.81 Cr. Cash flow from operating activities remained negative, reflecting a cash outflow of 10.00 Cr in Mar'25, although cash flow from financing activities showed a positive inflow of 23.00 Cr. Overall, the financial metrics indicate a challenging year for Add-Shop E-Reta, with declining sales and profits but an increase in total assets and liabilities.

View full answer

Is Add-Shop E-Reta. overvalued or undervalued?

13-Nov-2025

As of November 12, 2025, Add-Shop E-Reta. is considered attractive and undervalued with a PE ratio of 15.06, making it a more favorable investment compared to peers like Elitecon International and PTC India, despite recent stock performance lagging behind the Sensex.

As of 12 November 2025, the valuation grade for Add-Shop E-Reta. has moved from very attractive to attractive. The company is currently assessed as undervalued, with a PE ratio of 15.06, an EV to EBITDA of 9.43, and a PEG ratio of 0.09, indicating potential for growth relative to its price. <BR><BR>In comparison to its peers, Elitecon International is deemed very expensive with a PE ratio of 329.04, while PTC India, rated very attractive, has a significantly lower PE of 7.7. This suggests that Add-Shop E-Reta. offers a more favorable valuation relative to its industry competitors. Despite recent stock performance lagging behind the Sensex, particularly over the longer term, the current valuation metrics imply that the company presents a buying opportunity for investors.

View full answer

How has been the historical performance of Add-Shop E-Reta.?

12-Nov-2025

Add-Shop E-Reta experienced significant fluctuations in financial performance, with net sales dropping from 203.06 Cr in March 2024 to 155.13 Cr in March 2025, while operating profit decreased to 6.29 Cr. Despite a slight increase in profit after tax to 3.32 Cr, the company faced negative cash flow from operating activities at -10.00 Cr, alongside rising total assets and liabilities.

Answer:<BR>The historical performance of Add-Shop E-Reta has shown significant fluctuations over the years, particularly in net sales and profitability.<BR><BR>Breakdown:<BR>Add-Shop E-Reta's net sales peaked at 203.06 Cr in March 2024 but fell to 155.13 Cr by March 2025. The total operating income followed a similar trend, decreasing from 203.06 Cr in March 2024 to 155.13 Cr in March 2025. The company's total expenditure also decreased from 195.48 Cr in March 2024 to 148.84 Cr in March 2025, contributing to an operating profit of 6.29 Cr in March 2025, down from 7.58 Cr in the previous year. Profit before tax also declined to 4.52 Cr in March 2025 from 6.06 Cr in March 2024, while profit after tax slightly increased to 3.32 Cr from 3.16 Cr. The company's total assets grew from 125.95 Cr in March 2024 to 155.47 Cr in March 2025, driven by increases in inventories and sundry debtors. However, total liabilities also rose significantly from 125.95 Cr to 155.47 Cr, primarily due to an increase in short-term borrowings. Cash flow from operating activities remained negative at -10.00 Cr in March 2025, indicating ongoing challenges in cash generation despite financing activities contributing positively. Overall, the financial performance of Add-Shop E-Reta reflects a complex interplay of declining sales and profits against a backdrop of increasing assets and liabilities.

View full answer

Who are the top shareholders of the Add-Shop E-Reta.?

17-Jul-2025

The top shareholder of Add-Shop E-Reta is Dineshbhai Bhanushankar Pandya with 25.13%, followed by Jr Seamless Private Limited at 2.46%. Individual investors collectively hold 64.9%, with no mutual funds or foreign institutional investors involved.

The top shareholders of Add-Shop E-Reta include Dineshbhai Bhanushankar Pandya, who is the promoter with the highest holding at 25.13%. The highest public shareholder is Jr Seamless Private Limited, holding 2.46%. Additionally, individual investors collectively hold a significant portion of the company at 64.9%. There are no mutual funds or foreign institutional investors currently holding shares in the company.

View full answer

What is the technical trend for Add-Shop E-Reta.?

09-Jun-2025

As of June 3, 2025, Add-Shop E-Reta shows a mildly bearish trend with daily moving averages and Bollinger Bands indicating bearish conditions, while the MACD and KST suggest some underlying strength, creating a mixed technical outlook.

As of 3 June 2025, the technical trend for Add-Shop E-Reta has changed from sideways to mildly bearish. The daily moving averages indicate a mildly bearish stance, while the weekly Bollinger Bands also reflect bearish conditions. However, the MACD and KST on both weekly and monthly time frames are mildly bullish, suggesting some underlying strength. The RSI shows no signal on the weekly but is bullish on the monthly, indicating potential for recovery. Overall, the current technical stance is mildly bearish, with key indicators highlighting the bearish daily moving averages and Bollinger Bands, contrasted by the mildly bullish MACD and KST.

View full answer

What is the bonus history of the Add-Shop E-Reta.?

06-Jun-2025

Add-Shop E-Reta's recent bonus history includes a 7:10 ratio issued on January 14, 2022, with a record date of January 17, 2022, and a previous 3:4 ratio issued on July 22, 2020, with a record date of July 23, 2020.

Add-Shop E-Reta has a notable bonus history. The most recent bonus issue was a 7:10 ratio, which was announced with an ex-date of January 14, 2022, and a record date of January 17, 2022. Prior to that, the company had a bonus issue with a 3:4 ratio, which had an ex-date of July 22, 2020, and a record date of July 23, 2020. If you need more details or have further questions about the company, feel free to ask!

View full answer

Has Add-Shop E-Reta. declared dividend?

06-Jun-2025

No Dividend History Available

iScoreScore
Click here to find our call on this stock
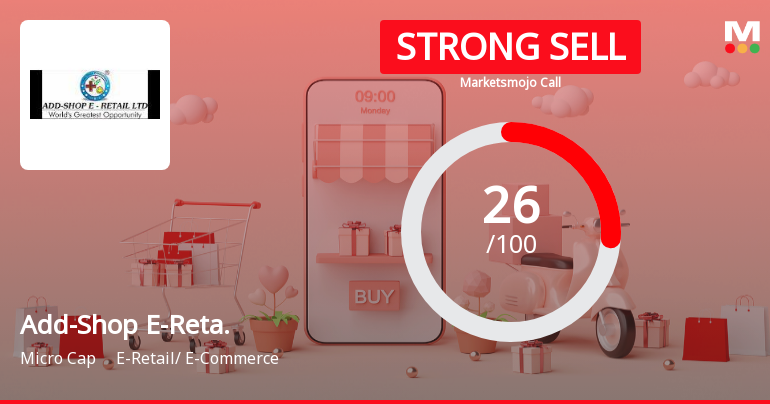
Strong Sell
Sell
Hold
Buy
Strong Buy

Dashboard

1

Weak Long Term Fundamental Strength with a -28.07% CAGR growth in Operating Profits over the last 5 years

 
2

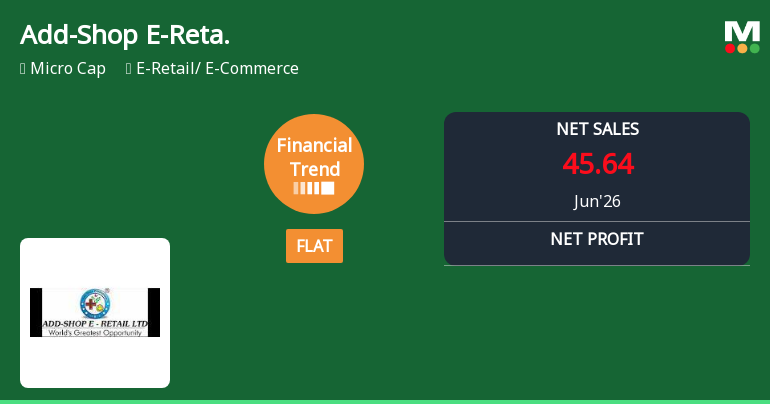
Flat results in Jun 26

3

Consistent Underperformance against the benchmark over the last 3 years

stock-summaryMojo Parameters

Mojo Parameters

Loading Valuation Snapshot...

Stock DNA

stock-summary
Industry

E-Retail/ E-Commerce

stock-summary
Market cap

INR 17 Cr (Micro Cap)

stock-summary
P/E

16.00

stock-summary
Industry P/E

21

stock-summary
Dividend Yield

0.00%

stock-summary
Debt Equity

0.11

stock-summary
Return on Equity

0.98%

stock-summary
Price to Book

0.15

Revenue and Profits:
Net Sales:
46 Cr
(Quarterly Results - Jun 2026)
Net Profit:
0 Cr
stock-summaryTotal Returns
Total Returns (Price + Dividend) stock-summary
Dividend Yield (0%)
TimePeriod
Price Return
Dividend Return
Total Return
3 Months
-14.43%
0%
-14.43%
6 Months
-22.36%
0%
-22.36%
1 Year
-38.78%
0%
-38.78%
2 Years
-61.96%
0%
-61.96%
3 Years
-83.46%
0%
-83.46%
4 Years
-93.25%
0%
-93.25%
5 Years
-91.18%
0%
-91.18%

Add-Shop E-Reta. for the last several years.

Risk Adjusted Returns v/s stock-summary
Returns Beta
Icon
Beta has not been calculated since enough price history is not available
stock-summaryNews & Corporate Actions

Announcements stock-summary

Announcement under Regulation 30 (LODR)-Newspaper Publication

31-Aug-2026 | Source : BSE

Submission of Newspaper Publication under Regulation 30 SEBI (LODR) Regulation 2015

Intimation Of Book Closure Pursuant To Regulation 42 Of The SEBI (Listing Obligation And Disclosure Requirement) Regulation 2015

31-Aug-2026 | Source : BSE

Intimation of Book Closure pursuant to Regulation 42 of the SEBI (LODR) Regulation 2015.

Reg. 34 (1) Annual Report.

27-Aug-2026 | Source : BSE

Submission of Annual Report Under Regulation 34 of the SEBI (Listing Obligations and Disclosure Requirements) Regulations

Corporate Actions stock-summary

stock-summary
BOARD MEETING

No Upcoming Board Meetings

stock-summary
DIVIDEND

No Dividend history available

stock-summary
SPLITS

No Splits history available

stock-summary
BONUS

Add-Shop E-Retail Ltd has announced 7:10 bonus issue, ex-date: 14 Jan 22

stock-summary
RIGHTS

Add-Shop E-Retail Ltd has announced 1:1 rights issue, ex-date: 05 Aug 22

stock-summaryKey Factors

Quality key factors stock-summary

Factor
Value
Sales Growth (5y)
11.45%
EBIT Growth (5y)
-28.07%
EBIT to Interest (avg)
11.61
Debt to EBITDA (avg)
0.80
Net Debt to Equity (avg)
0.11
Sales to Capital Employed (avg)
1.90
Tax Ratio
29.56%
Dividend Payout Ratio
0
Pledged Shares
0
Institutional Holding
0
ROCE (avg)
20.85%
ROE (avg)
14.62%

Valuation key factors

Factor
Value
P/E Ratio
16
Industry P/E
21
Price to Book Value
0.15
EV to EBIT
10.60
EV to EBITDA
8.78
EV to Capital Employed
0.24
EV to Sales
0.17
PEG Ratio
NA
Dividend Yield
NA
ROCE (Latest)
2.16%
ROE (Latest)
0.98%

Technicals key factors

Indicator
Weekly
Monthly
MACD
Bearish
Mildly Bullish
RSI
No Signal
No Signal
Bollinger Bands
Mildly Bearish
Sideways
Moving Averages
Bearish (Daily)
KST
Bearish
Mildly Bullish
Dow Theory
Bearish
No Trend
stock-summary Technical Indicator Scale: Bearish, Mildly Bearish, Sideways, Mildly Bullish, Bullish  Turned 
stock-summaryShareholding
Shareholding Snapshot : Jun 2026stock-summary
Shareholding Compare (%holding) stock-summary
Majority shareholders

Non Institution

Pledged Promoter Holdings

None

Mutual Funds

Held by 0 Schemes

FIIs

Held by 0 FIIs

Promoter with highest holding

Dineshbhai Bhanushankar Pandya (25.13%)

Highest Public shareholder

Jr Seamless Private Limited (2.46%)

Individual Investors Holdings

64.62%

stock-summaryFinancial
[
  {
    "link": "quarterly",
    "btn_text": "All Quarterly Results",
    "header": "Quarterly Results Snapshot (Standalone) - Jun'26 - QoQ",
    "rhs": [
      {
        "prefix": "Net Sales ",
        "suffix": "QoQ Growth in quarter ended Jun 2026 is -19.92% vs 63.53% in Mar 2026",
        "dir": -1
      },
      {
        "prefix": "Standalone Net Profit ",
        "suffix": "QoQ Growth in quarter ended Jun 2026 is -25.00% vs 38.46% in Mar 2026",
        "dir": -1
      }
    ],
    "table": {
      "header": [
        "Jun'26",
        "Mar'26",
        "Change(%)"
      ],
      "body": [
        {
          "field": "Net Sales",
          "val1": "45.64",
          "val2": "56.99",
          "chgp": "-19.92%",
          "chgp_class": "negative"
        },
        {
          "field": "Operating Profit (PBDIT) excl Other Income",
          "val1": "0.86",
          "val2": "0.97",
          "chgp": "-11.34%",
          "chgp_class": "negative"
        },
        {
          "field": "Interest",
          "val1": "0.34",
          "val2": "0.28",
          "chgp": "21.43%",
          "chgp_class": "negative"
        },
        {
          "field": "Exceptional Items",
          "val1": "0.00",
          "val2": "0.00",
          "chgp": "",
          "chgp_class": "neutral"
        },
        {
          "field": "Standalone Net Profit",
          "val1": "0.27",
          "val2": "0.36",
          "chgp": "-25.00%",
          "chgp_class": "negative"
        },
        {
          "field": "Operating Profit Margin (Excl OI)",
          "val1": "1.88%",
          "val2": "1.70%",
          "chgp": "0.18%",
          "chgp_class": "positive"
        }
      ]
    }
  },
  {
    "link": "half-yearly",
    "btn_text": "All Half Yearly Results",
    "header": "Half Yearly Results Snapshot (Standalone) - Sep'25",
    "rhs": [
      {
        "prefix": "Net Sales ",
        "suffix": " Growth in half year ended Sep 2025 is -12.23% vs -18.39% in Sep 2024",
        "dir": 1
      },
      {
        "prefix": "Standalone Net Profit ",
        "suffix": " Growth in half year ended Sep 2025 is -78.43% vs -73.23% in Sep 2024",
        "dir": -1
      }
    ],
    "table": {
      "header": [
        "Sep'25",
        "Sep'24",
        "Change(%)"
      ],
      "body": [
        {
          "field": "Net Sales",
          "val1": "62.81",
          "val2": "71.56",
          "chgp": "-12.23%",
          "chgp_class": "negative"
        },
        {
          "field": "Operating Profit (PBDIT) excl Other Income",
          "val1": "1.52",
          "val2": "3.71",
          "chgp": "-59.03%",
          "chgp_class": "negative"
        },
        {
          "field": "Interest",
          "val1": "0.63",
          "val2": "0.65",
          "chgp": "-3.08%",
          "chgp_class": "positive"
        },
        {
          "field": "Exceptional Items",
          "val1": "0.00",
          "val2": "0.00",
          "chgp": "",
          "chgp_class": "neutral"
        },
        {
          "field": "Standalone Net Profit",
          "val1": "0.44",
          "val2": "2.04",
          "chgp": "-78.43%",
          "chgp_class": "negative"
        },
        {
          "field": "Operating Profit Margin (Excl OI)",
          "val1": "2.42%",
          "val2": "5.18%",
          "chgp": "-2.76%",
          "chgp_class": "negative"
        }
      ]
    }
  },
  {
    "link": "nine-monthly",
    "btn_text": "All Nine Monthly Results",
    "header": "Nine Monthly Results Snapshot (Standalone) - Dec'25",
    "rhs": [
      {
        "prefix": "Net Sales ",
        "suffix": "YoY Growth in nine months ended Dec 2025 is -7.33% vs -27.16% in Dec 2024",
        "dir": 1
      },
      {
        "prefix": "Standalone Net Profit ",
        "suffix": "YoY Growth in nine months ended Dec 2025 is -76.35% vs -70.81% in Dec 2024",
        "dir": -1
      }
    ],
    "table": {
      "header": [
        "Dec'25",
        "Dec'24",
        "Change(%)"
      ],
      "body": [
        {
          "field": "Net Sales",
          "val1": "97.66",
          "val2": "105.39",
          "chgp": "-7.33%",
          "chgp_class": "negative"
        },
        {
          "field": "Operating Profit (PBDIT) excl Other Income",
          "val1": "2.32",
          "val2": "5.37",
          "chgp": "-56.80%",
          "chgp_class": "negative"
        },
        {
          "field": "Interest",
          "val1": "0.92",
          "val2": "0.94",
          "chgp": "-2.13%",
          "chgp_class": "positive"
        },
        {
          "field": "Exceptional Items",
          "val1": "0.00",
          "val2": "0.00",
          "chgp": "",
          "chgp_class": "neutral"
        },
        {
          "field": "Standalone Net Profit",
          "val1": "0.70",
          "val2": "2.96",
          "chgp": "-76.35%",
          "chgp_class": "negative"
        },
        {
          "field": "Operating Profit Margin (Excl OI)",
          "val1": "2.38%",
          "val2": "5.10%",
          "chgp": "-2.72%",
          "chgp_class": "negative"
        }
      ]
    }
  },
  {
    "link": "annual",
    "btn_text": "All Annual Results",
    "header": "Annual Results Snapshot (Standalone) - Mar'26",
    "rhs": [
      {
        "prefix": "Net Sales ",
        "suffix": "YoY Growth in year ended Mar 2026 is 0.05% vs -23.60% in Mar 2025",
        "dir": 1
      },
      {
        "prefix": "Standalone Net Profit ",
        "suffix": "YoY Growth in year ended Mar 2026 is -68.37% vs 5.06% in Mar 2025",
        "dir": -1
      }
    ],
    "table": {
      "header": [
        "Mar'26",
        "Mar'25",
        "Change(%)"
      ],
      "body": [
        {
          "field": "Net Sales",
          "val1": "155.20",
          "val2": "155.13",
          "chgp": "0.05%",
          "chgp_class": "positive"
        },
        {
          "field": "Operating Profit (PBDIT) excl Other Income",
          "val1": "3.30",
          "val2": "6.29",
          "chgp": "-47.54%",
          "chgp_class": "negative"
        },
        {
          "field": "Interest",
          "val1": "1.20",
          "val2": "1.22",
          "chgp": "-1.64%",
          "chgp_class": "positive"
        },
        {
          "field": "Exceptional Items",
          "val1": "0.00",
          "val2": "0.00",
          "chgp": "",
          "chgp_class": "neutral"
        },
        {
          "field": "Standalone Net Profit",
          "val1": "1.05",
          "val2": "3.32",
          "chgp": "-68.37%",
          "chgp_class": "negative"
        },
        {
          "field": "Operating Profit Margin (Excl OI)",
          "val1": "2.13%",
          "val2": "4.05%",
          "chgp": "-1.92%",
          "chgp_class": "negative"
        }
      ]
    }
  }
]

Quarterly Results Snapshot (Standalone) - Jun'26 - QoQstock-summary

Jun'26
Mar'26
Change(%)
Net Sales
45.64
56.99
-19.92%
Operating Profit (PBDIT) excl Other Income
0.86
0.97
-11.34%
Interest
0.34
0.28
21.43%
Exceptional Items
0.00
0.00
Standalone Net Profit
0.27
0.36
-25.00%
Operating Profit Margin (Excl OI)
1.88%
1.70%
0.18%
Values in Rs Cr.
Direction Arrows
Net Sales

QoQ Growth in quarter ended Jun 2026 is -19.92% vs 63.53% in Mar 2026

Direction Arrows
Standalone Net Profit

QoQ Growth in quarter ended Jun 2026 is -25.00% vs 38.46% in Mar 2026

Half Yearly Results Snapshot (Standalone) - Sep'25stock-summary

Sep'25
Sep'24
Change(%)
Net Sales
62.81
71.56
-12.23%
Operating Profit (PBDIT) excl Other Income
1.52
3.71
-59.03%
Interest
0.63
0.65
-3.08%
Exceptional Items
0.00
0.00
Standalone Net Profit
0.44
2.04
-78.43%
Operating Profit Margin (Excl OI)
2.42%
5.18%
-2.76%
Values in Rs Cr.
Direction Arrows
Net Sales

Growth in half year ended Sep 2025 is -12.23% vs -18.39% in Sep 2024

Direction Arrows
Standalone Net Profit

Growth in half year ended Sep 2025 is -78.43% vs -73.23% in Sep 2024

Nine Monthly Results Snapshot (Standalone) - Dec'25stock-summary

Dec'25
Dec'24
Change(%)
Net Sales
97.66
105.39
-7.33%
Operating Profit (PBDIT) excl Other Income
2.32
5.37
-56.80%
Interest
0.92
0.94
-2.13%
Exceptional Items
0.00
0.00
Standalone Net Profit
0.70
2.96
-76.35%
Operating Profit Margin (Excl OI)
2.38%
5.10%
-2.72%
Values in Rs Cr.
Direction Arrows
Net Sales

YoY Growth in nine months ended Dec 2025 is -7.33% vs -27.16% in Dec 2024

Direction Arrows
Standalone Net Profit

YoY Growth in nine months ended Dec 2025 is -76.35% vs -70.81% in Dec 2024

Annual Results Snapshot (Standalone) - Mar'26stock-summary

Mar'26
Mar'25
Change(%)
Net Sales
155.20
155.13
0.05%
Operating Profit (PBDIT) excl Other Income
3.30
6.29
-47.54%
Interest
1.20
1.22
-1.64%
Exceptional Items
0.00
0.00
Standalone Net Profit
1.05
3.32
-68.37%
Operating Profit Margin (Excl OI)
2.13%
4.05%
-1.92%
Values in Rs Cr.
Direction Arrows
Net Sales

YoY Growth in year ended Mar 2026 is 0.05% vs -23.60% in Mar 2025

Direction Arrows
Standalone Net Profit

YoY Growth in year ended Mar 2026 is -68.37% vs 5.06% in Mar 2025

stock-summaryCompany CV
About Add-Shop E-Retail Ltd stock-summary
stock-summary
Add-Shop E-Retail Ltd
Micro Cap
E-Retail/ E-Commerce
Add-Shop E-Retail Limited was originally incorporated as a Private Limited Company as "Add-Shop Promotions Private Limited" at Rajkot, Gujarat on August 20, 2013. Subsequently the Company was converted into a Public Limited and name of the Company was changed to "Add-Shop Promotions Limited" on June 21, 2018. Further, the name of the Company was changed from "Add-Shop Promotions Limited" to "Add-Shop E-Retail Limited" on February 8, 2020.
Company Coordinates stock-summary
Company Details
B-304 Imperial Height, 150 ft Ring Road Rajkot Gujarat : 360005
stock-summary
Tel: 91-281-2580499
stock-summary
investor@addshop.co
Registrar Details
Cameo Corporate Services Ltd , Subramanian Buildings No 1 , Club House Road, Chennai