
Compare Aditya Infotech with Similar Stocks
Dashboard
Strong Long Term Fundamental Strength with an average Return on Equity (ROE) of 31.32%
- Healthy long term growth as Net Sales has grown by an annual rate of 28.30% and Operating profit at 43.99%
- Company has a Debt to Equity ratio (avg) of 0.56 times
With a growth in Net Profit of 78.53%, the company declared Very Positive results in Mar 26
With its market cap of Rs 41,860 cr, it is the biggest company in the sector and constitutes 42.97% of the entire sector
Stock DNA
IT - Hardware
INR 42,426 Cr (Small Cap)
116.00
34
0.00%
-0.03
20.76%
25.51
Total Returns (Price + Dividend) 
Aditya Infotech for the last several years.
Risk Adjusted Returns v/s
Returns Beta

News
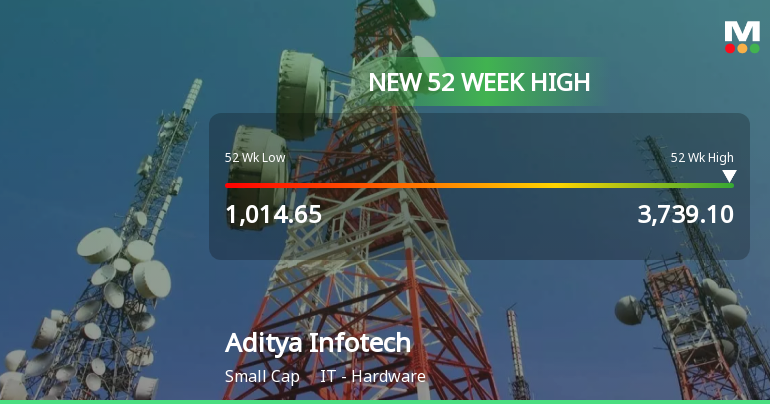
Broad-Based Technical Strength Lifts Aditya Infotech Ltd to 52-Week High of Rs 3739.1
With a decisive break above Rs 3,700, Aditya Infotech Ltd has reached a new 52-week high of Rs 3,739.1 on 22 Jun 2026, marking a significant milestone in its price momentum. This surge comes amid a backdrop of strong technical signals and sustained gains over the past three sessions, underscoring the stock’s robust upward trajectory.
Read full news article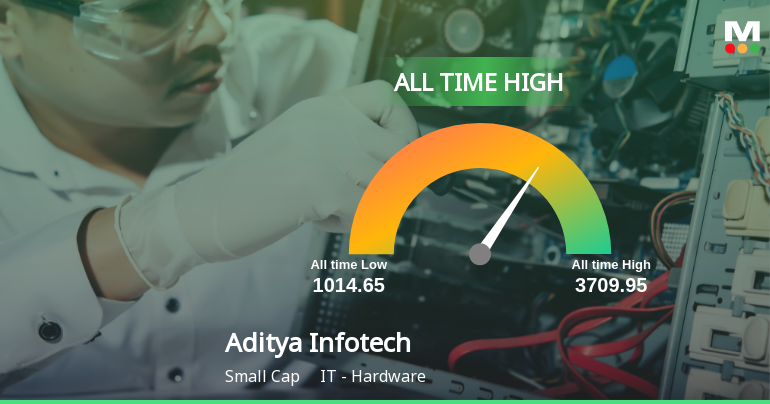
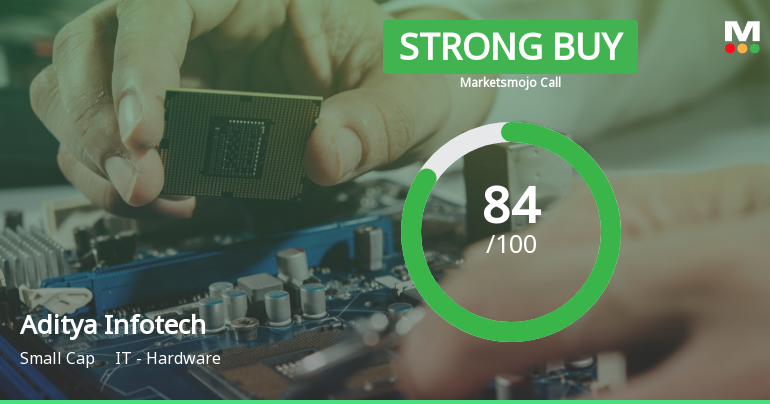
Aditya Infotech Ltd is Rated Strong Buy
Aditya Infotech Ltd is rated Strong Buy by MarketsMOJO, with this rating last updated on 01 June 2026. While the rating change occurred on that date, the analysis and financial metrics presented here reflect the stock's current position as of 21 June 2026, providing investors with the latest insights into the company’s performance and outlook.
Read full news article Announcements
Announcement under Regulation 30 (LODR)-Updates on Acquisition
10-Jun-2026 | Source : BSEIncorporation of Joint Venture Company under the name and style of Corelink Cable Technology Private Limited
Announcement under Regulation 30 (LODR)-Analyst / Investor Meet - Intimation
10-Jun-2026 | Source : BSESchedule of Analyst/Institutional investor meeting to be held on June 16 2026.
Announcement under Regulation 30 (LODR)-Earnings Call Transcript
03-Jun-2026 | Source : BSETranscript of Earnings call held on May 28 2026
Corporate Actions

No Upcoming Board Meetings

No Dividend history available

No Splits history available

No Bonus history available

No Rights history available
Quality key factors
Valuation key factors
Technicals key factors
 Technical Indicator Scale: Bearish, Mildly Bearish, Sideways, Mildly Bullish, Bullish Turned
 Shareholding Snapshot : Mar 2026
Shareholding Compare (%holding)
Promoters
None
Held by 25 Schemes (13.08%)
Held by 54 FIIs (5.72%)
Aditya Khemka (31.54%)
Invesco India Flexi Cap Fund (4.01%)
1.8%
Quarterly Results Snapshot (Standalone) - Mar'26 - QoQ

QoQ Growth in quarter ended Mar 2026 is 25.93% vs 24.43% in Dec 2025
QoQ Growth in quarter ended Mar 2026 is 78.53% vs 33.07% in Dec 2025
Half Yearly Results Snapshot (Standalone) - Sep'25
Not Applicable: The company has declared_date for only one period
Not Applicable: The company has declared_date for only one period
Nine Monthly Results Snapshot (Standalone) - Dec'25
Not Applicable: The company has declared_date for only one period
Not Applicable: The company has declared_date for only one period
Annual Results Snapshot (Consolidated) - Mar'26
YoY Growth in year ended Mar 2026 is 35.64% vs 11.84% in Mar 2025

YoY Growth in year ended Mar 2026 is 4.72% vs 205.09% in Mar 2025
About Aditya Infotech Ltd

Company Coordinates


