
Compare Aditya Ispat with Similar Stocks
Dashboard
With a Negative Book Value, the company has a Weak Long Term Fundamental Strength
- Poor long term growth as Net Sales has grown by an annual rate of -7.99% and Operating profit at -231.27% over the last 5 years
- The company has a negative book value of Rs 0.76 crore
- The company has been able to generate a Return on Equity (avg) of 2.35% signifying low profitability per unit of shareholders funds
The company has declared Negative results for the last 5 consecutive quarters
Risky - Negative EBITDA
100% of Promoter Shares are Pledged
Stock DNA
Iron & Steel Products
INR 5 Cr (Micro Cap)
NA (Loss Making)
14
0.00%
-11.08
746.00%
-4.59
Total Returns (Price + Dividend) 
Aditya Ispat for the last several years.
Risk Adjusted Returns v/s
Returns Beta

News
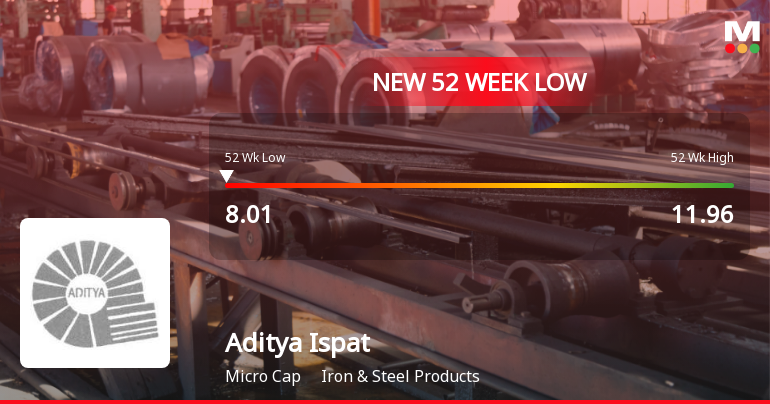
Aditya Ispat Ltd. Falls to 52-Week Low of Rs 8.01 as Sell-Off Deepens
For the fifth consecutive session, Aditya Ispat Ltd. closed lower, slipping to a fresh 52-week low of Rs 8.01 on 20 Jul 2026. This decline comes amid a broader market downturn, but the stock’s underperformance is particularly pronounced, falling 8.46% on the day and underperforming its sector by over 9%. The persistent slide raises questions about the underlying pressures facing the company and whether any signs of stabilisation are emerging.
Read full news articleAre Aditya Ispat Ltd. latest results good or bad?
Aditya Ispat Ltd. has reported its financial results for Q4 FY26, revealing significant operational challenges despite a year-on-year revenue growth of 14.69% to ₹9.37 crores. However, this revenue increase is overshadowed by a substantial net loss of ₹5.11 crores, which reflects a drastic decline in profitability compared to the previous quarter. The operating margin has deteriorated sharply to -64.14%, marking the worst performance on record for the company. The financial data indicates that while net sales showed some growth, the company's cost structure has led to unprecedented operational inefficiencies, resulting in a loss before tax that widened significantly. The profit after tax margin also fell sharply to -54.54%, highlighting ongoing difficulties in managing expenses effectively. In terms of leverage, Aditya Ispat's debt-to-equity ratio stands at a high level, indicating a precarious financial ...
Read full news article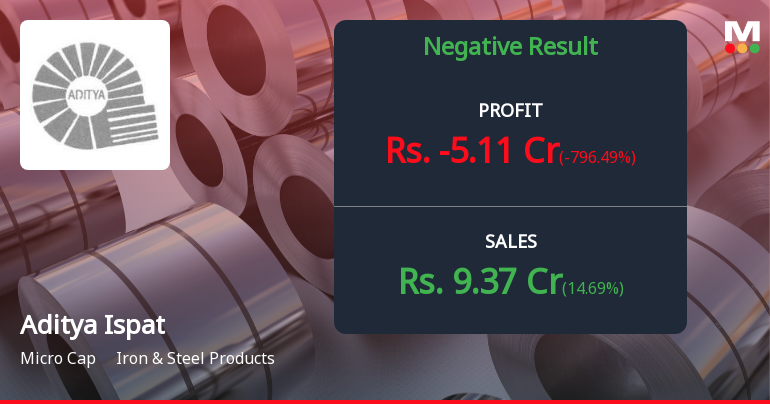
Aditya Ispat Q4 FY26: Operating Losses Deepen as Margins Collapse to -64%
Aditya Ispat Ltd., a micro-cap steel manufacturer based in Hyderabad, reported a catastrophic fourth quarter for FY26, posting a net loss of ₹5.11 crores—a staggering 796.50% deterioration from the previous quarter's loss of ₹0.44 crores. The company's operating margin collapsed to -64.14% in Q4 FY26, marking the worst quarterly performance in recent history and raising serious questions about operational viability.
Read full news article Announcements
Announcement Under Regulation 30(LODR) Updates
30-Jun-2026 | Source : BSEkindly find attached update on BTA
Closure of Trading Window
26-Jun-2026 | Source : BSEClosure of Trading Window for the Purpose of Unaudited Financial Results for the Quarter Ended June 302026
Announcement under Regulation 30 (LODR)-Newspaper Publication
02-Jun-2026 | Source : BSENewspaper Publication of Financial Results for the Quarter and Year Ended March 312026
Corporate Actions

No Upcoming Board Meetings

No Dividend history available

No Splits history available

No Bonus history available

No Rights history available
Quality key factors
Valuation key factors
Technicals key factors
 Technical Indicator Scale: Bearish, Mildly Bearish, Sideways, Mildly Bullish, Bullish Turned
 Shareholding Snapshot : Jun 2026
Shareholding Compare (%holding)
Non Institution
100
Held by 0 Schemes
Held by 0 FIIs
Usha Chachan (8.9%)
S D Chachan Commercial Private Limited (8.53%)
58.31%
Quarterly Results Snapshot (Standalone) - Mar'26 - YoY

YoY Growth in quarter ended Mar 2026 is 14.69% vs -56.63% in Mar 2025

YoY Growth in quarter ended Mar 2026 is -796.49% vs 75.54% in Mar 2025
Half Yearly Results Snapshot (Standalone) - Sep'25
Growth in half year ended Sep 2025 is -36.82% vs -23.04% in Sep 2024
Growth in half year ended Sep 2025 is -78.50% vs -5,450.00% in Sep 2024
Nine Monthly Results Snapshot (Standalone) - Dec'25
YoY Growth in nine months ended Dec 2025 is -34.54% vs -17.16% in Dec 2024
YoY Growth in nine months ended Dec 2025 is -1,019.05% vs -1,150.00% in Dec 2024
Annual Results Snapshot (Standalone) - Mar'26
YoY Growth in year ended Mar 2026 is -25.38% vs -29.16% in Mar 2025
YoY Growth in year ended Mar 2026 is -1,000.00% vs 66.23% in Mar 2025
About Aditya Ispat Ltd.

Company Coordinates


