
Compare Ador Welding with Similar Stocks
Dashboard
High Management Efficiency with a high ROE of 15.16%
The company is Net-Debt Free
Healthy long term growth as Operating profit has grown by an annual rate 61.77%
With a growth in Net Profit of 89.05%, the company declared Very Positive results in Mar 26
With ROE of 15.2, it has a Fair valuation with a 4.5 Price to Book Value
Stock DNA
Other Industrial Products
INR 2,525 Cr (Small Cap)
30.00
43
1.59%
-0.22
15.19%
4.55
Total Returns (Price + Dividend) 
Latest dividend: 22.988117204221712 per share ex-dividend date: Jul-16-2026
Risk Adjusted Returns v/s
Returns Beta

News
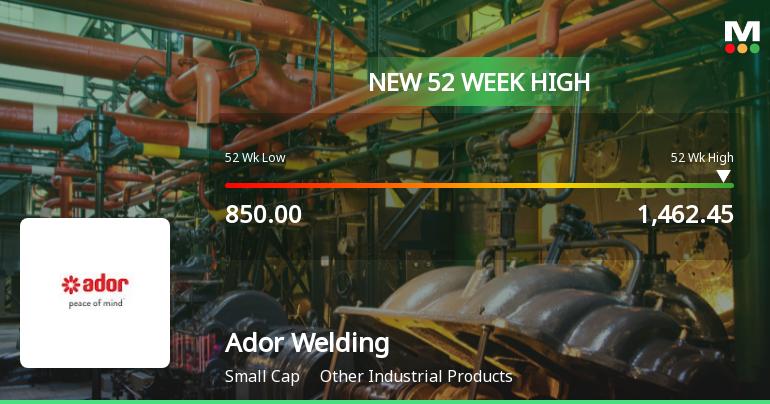
Broad-Based Technical Strength Lifts Ador Welding Ltd to 52-Week High of Rs 1462.45
With a decisive breakthrough to Rs 1462.45 on 21 Jul 2026, Ador Welding Ltd has cemented its position at a fresh 52-week high, propelled by a confluence of robust technical indicators and sustained price momentum.
Read full news article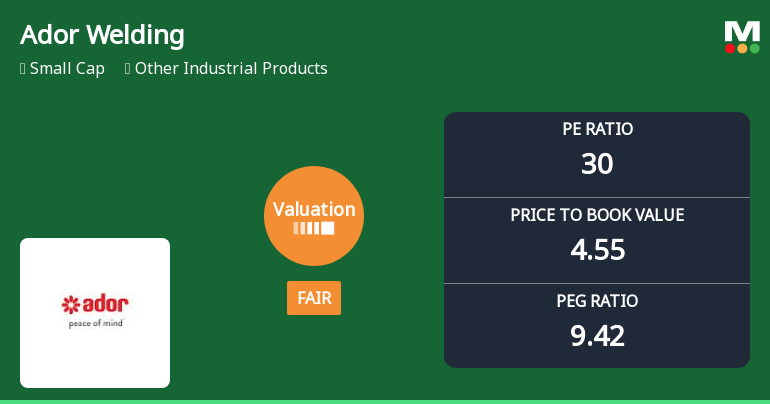
Ador Welding Ltd Valuation Shifts Signal Changing Price Attractiveness
Ador Welding Ltd, a prominent player in the Other Industrial Products sector, has experienced a notable shift in its valuation parameters, moving from an attractive to a fair valuation grade. This change reflects evolving market perceptions amid strong price momentum and robust financial performance, prompting investors to reassess the stock’s price attractiveness relative to its historical and peer benchmarks.
Read full news article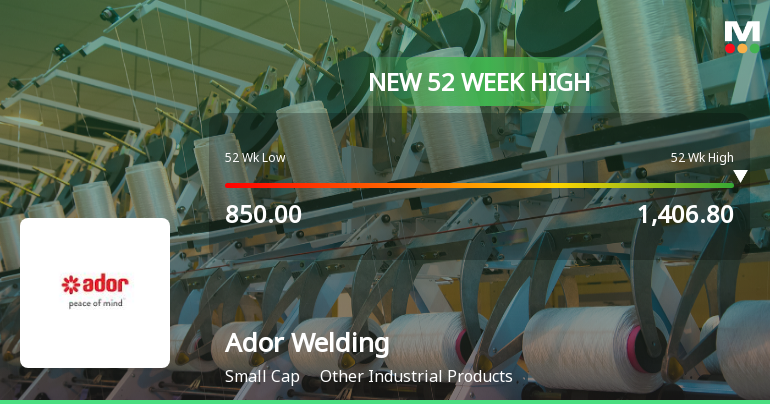
Broad-Based Technical Strength Lifts Ador Welding Ltd to 52-Week High of Rs 1420.4
With a decisive break above Rs 1420.4 on 20 Jul 2026, Ador Welding Ltd has reached a fresh 52-week high, propelled by a confluence of bullish technical indicators and sustained price momentum that outpaces its sector and the broader market.
Read full news article Announcements
Ador Welding Limited - Other General Purpose
03-Dec-2019 | Source : NSEAdor Welding Limited has informed the Exchange regarding Disclosure of Related Party Transactions for the half year ended September 30, 2019
Ador Welding Limited - Analysts/Institutional Investor Meet/Con. Call Updates
18-Nov-2019 | Source : NSEAdor Welding Limited has informed the Exchange regarding Analysts/Institutional Investor Meet/Con. Call Updates
Ador Welding Limited - Press Release
15-Nov-2019 | Source : NSEAdor Welding Limited has informed the Exchange regarding a press release dated November 14, 2019, titled "Submission of copies of newspaper publication under Regulation 47 (1) of SEBI (Listing Obligations and Disclosure Requirements) Regulations, 2015".
Corporate Actions

(21 Jul 2026)

Ador Welding Ltd has declared 230% dividend, ex-date: 16 Jul 26

No Splits history available

No Bonus history available

No Rights history available
Quality key factors
Valuation key factors
Technicals key factors
 Technical Indicator Scale: Bearish, Mildly Bearish, Sideways, Mildly Bullish, Bullish Turned
 Shareholding Snapshot : Sep 2025
Shareholding Compare (%holding)
Promoters
None
Held by 5 Schemes (6.68%)
Held by 8 FIIs (0.09%)
J B Advani And Company Pvt Limited (45.23%)
Clarus Capital I (5.8%)
24.54%
Quarterly Results Snapshot (Consolidated) - Mar'26 - YoY

YoY Growth in quarter ended Mar 2026 is 2.89% vs 4.26% in Mar 2025

YoY Growth in quarter ended Mar 2026 is 89.05% vs -28.70% in Mar 2025
Half Yearly Results Snapshot (Consolidated) - Sep'25
Growth in half year ended Sep 2025 is -1.07% vs 4.62% in Sep 2024
Growth in half year ended Sep 2025 is -20.68% vs -37.35% in Sep 2024
Nine Monthly Results Snapshot (Consolidated) - Dec'25
YoY Growth in nine months ended Dec 2025 is 1.03% vs 4.69% in Dec 2024
YoY Growth in nine months ended Dec 2025 is 13.87% vs -31.31% in Dec 2024
Annual Results Snapshot (Consolidated) - Mar'26
YoY Growth in year ended Mar 2026 is 1.54% vs 4.57% in Mar 2025
YoY Growth in year ended Mar 2026 is 36.52% vs -30.55% in Mar 2025
About Ador Welding Ltd

Company Coordinates


