
Compare Advance Meter. with Similar Stocks
Dashboard
With a Operating Losses, the company has a Weak Long Term Fundamental Strength
- Company's ability to service its debt is weak with a poor EBIT to Interest (avg) ratio of -7.92
- The company has reported losses. Due to this company has reported negative ROCE
Flat results in Mar 26
Risky - Negative EBITDA
Underperformed the market in the last 1 year
Stock DNA
Power
INR 31 Cr (Micro Cap)
NA (Loss Making)
61
0.00%
-0.19
-12.64%
0.39
Total Returns (Price + Dividend) 
Advance Meter. for the last several years.
Risk Adjusted Returns v/s
Returns Beta

News
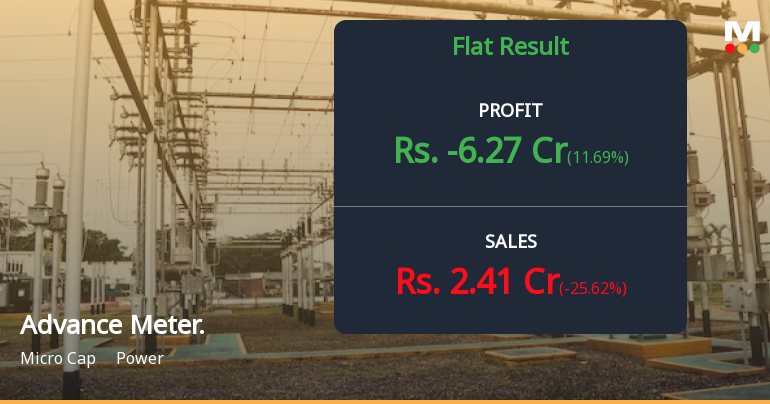
Advance Metering Technology Q4 FY26: Losses Deepen as Revenue Plummets 26%
Advance Metering Technology Ltd. reported a dismal fourth quarter for FY26, posting a consolidated net loss of ₹6.27 crores compared to a loss of ₹7.10 crores in the same quarter last year. Despite the sequential deterioration, the stock managed to gain 1.43% on May 29, 2026, trading at ₹19.90 against a market capitalisation of just ₹32.00 crores, positioning the company as a micro-cap player in the power sector.
Read full news article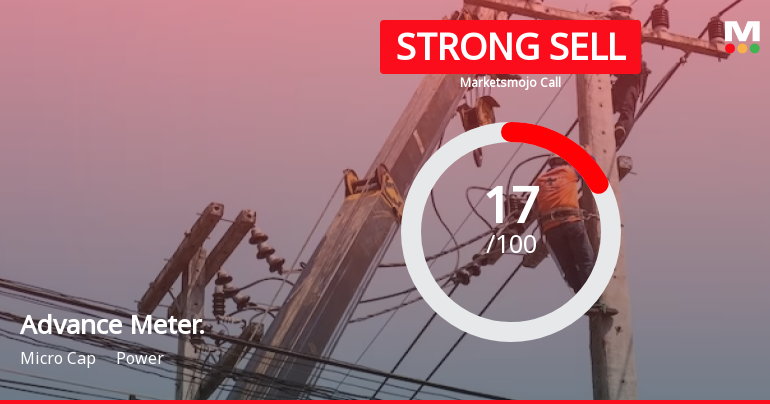
Advance Metering Technology Ltd is Rated Strong Sell
Advance Metering Technology Ltd is rated Strong Sell by MarketsMOJO. This rating was last updated on 29 Jul 2024, reflecting a shift from a previous 'Sell' grade. However, the analysis and financial metrics discussed here represent the company’s current position as of 28 May 2026, providing investors with an up-to-date view of its performance and outlook.
Read full news article Announcements
Shareholder Meeting / Postal Ballot-Scrutinizers Report
09-Jun-2026 | Source : BSEScrutinizers Report of Postal Ballot through Remote E-Voting
Shareholder Meeting / Postal Ballot-Outcome of Postal_Ballot
09-Jun-2026 | Source : BSEVoting Results of Postal Ballot through Remote E-Voting
Compliances-Reg.24(A)-Annual Secretarial Compliance
30-May-2026 | Source : BSEAnnual Secretarial Compliance Report under Regulation 24A of the SEBI(LODR) Regulations 2015 for the FY Ended 31st March 2026.
Corporate Actions

No Upcoming Board Meetings

No Dividend history available

No Splits history available

No Bonus history available

No Rights history available
Quality key factors
Valuation key factors
Technicals key factors
 Technical Indicator Scale: Bearish, Mildly Bearish, Sideways, Mildly Bullish, Bullish Turned
 Shareholding Snapshot : Mar 2026
Shareholding Compare (%holding)
Promoters
None
Held by 0 Schemes
Held by 0 FIIs
Pkr Hitech Industrial Corporation Llp (43.23%)
Mahendra Girdharilal Wadhwani (1.49%)
31.47%
Quarterly Results Snapshot (Consolidated) - Mar'26 - YoY

YoY Growth in quarter ended Mar 2026 is -25.62% vs 16.13% in Mar 2025

YoY Growth in quarter ended Mar 2026 is 11.69% vs -147.39% in Mar 2025
Half Yearly Results Snapshot (Consolidated) - Sep'25
Growth in half year ended Sep 2025 is -1.45% vs -11.70% in Sep 2024
Growth in half year ended Sep 2025 is -128.63% vs 485.00% in Sep 2024
Nine Monthly Results Snapshot (Consolidated) - Dec'25
YoY Growth in nine months ended Dec 2025 is -9.03% vs -10.49% in Dec 2024
YoY Growth in nine months ended Dec 2025 is -73.52% vs -354.65% in Dec 2024
Annual Results Snapshot (Consolidated) - Mar'26
YoY Growth in year ended Mar 2026 is -12.49% vs -5.99% in Mar 2025
YoY Growth in year ended Mar 2026 is -8.28% vs -362.69% in Mar 2025
About Advance Metering Technology Ltd

Company Coordinates


