
Compare Aeroflex with Similar Stocks
Dashboard
The company is Net-Debt Free
Poor long term growth as Operating profit has grown by an annual rate 15.15% of over the last 5 years
Positive results in Mar 26
With ROE of 10.7, it has a Very Expensive valuation with a 12.1 Price to Book Value
Increasing Participation by Institutional Investors
Market Beating Performance
Stock DNA
Iron & Steel Products
INR 5,360 Cr (Small Cap)
98.00
26
0.17%
-0.15
10.70%
12.17
Total Returns (Price + Dividend) 
Latest dividend: 0.39392344497607656 per share ex-dividend date: Jul-14-2026
Risk Adjusted Returns v/s
Returns Beta

News
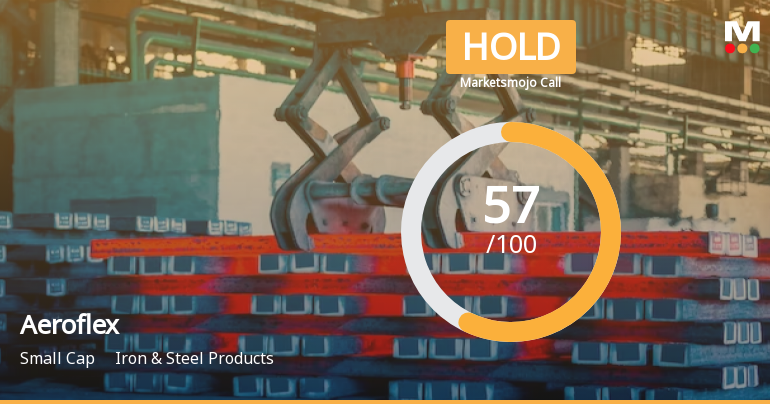
Aeroflex Industries Ltd is Rated Hold
Aeroflex Industries Ltd is rated 'Hold' by MarketsMOJO, with this rating last updated on 30 January 2026. However, the analysis and financial metrics discussed here reflect the stock's current position as of 17 July 2026, providing investors with an up-to-date perspective on its performance and outlook.
Read full news article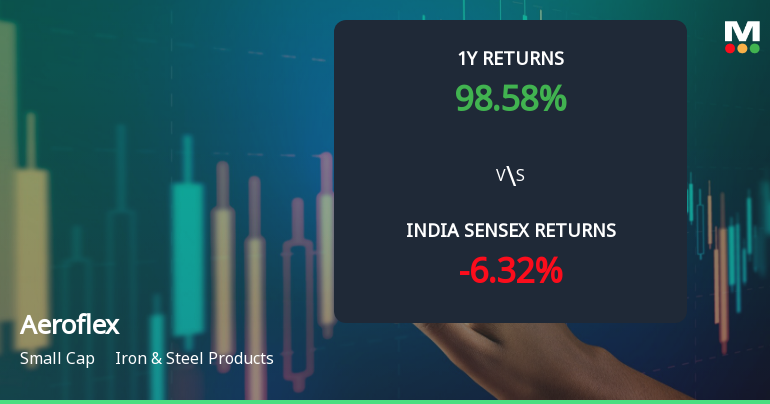
Aeroflex Industries Ltd Technical Momentum Shifts Amid Mixed Market Signals
Aeroflex Industries Ltd, a small-cap player in the Iron & Steel Products sector, has experienced a nuanced shift in its technical momentum, reflecting a complex interplay of bullish and bearish signals across multiple timeframes. Despite a recent downgrade from a Sell to a Hold rating by MarketsMOJO on 30 January 2026, the stock’s year-to-date return of 113.35% significantly outpaces the Sensex’s negative 9.58%, underscoring its volatile yet promising trajectory.
Read full news article
Aeroflex Industries Ltd Technical Momentum Shifts Signal Bullish Outlook
Aeroflex Industries Ltd has demonstrated a significant shift in technical momentum, upgrading its outlook from mildly bullish to bullish as of early 2026. This change is supported by a confluence of positive signals from key technical indicators including MACD, moving averages, and Bollinger Bands, suggesting renewed investor confidence in the iron and steel products sector stock.
Read full news article Announcements
Corporate Actions

No Upcoming Board Meetings

Aeroflex Industries Ltd has declared 20% dividend, ex-date: 14 Jul 26

No Splits history available

No Bonus history available

No Rights history available
Quality key factors
Valuation key factors
Technicals key factors
 Technical Indicator Scale: Bearish, Mildly Bearish, Sideways, Mildly Bullish, Bullish Turned
 Shareholding Snapshot : Mar 2026
Shareholding Compare (%holding)
Promoters
None
Held by 2 Schemes (2.12%)
Held by 20 FIIs (1.49%)
Aeroflex Enterprises Limited (59.84%)
Ashish Kacholia (2.27%)
22.34%
Quarterly Results Snapshot (Consolidated) - Mar'26 - QoQ

QoQ Growth in quarter ended Mar 2026 is 4.09% vs 9.04% in Dec 2025
QoQ Growth in quarter ended Mar 2026 is 6.97% vs 15.88% in Dec 2025
Half Yearly Results Snapshot (Consolidated) - Sep'25
Growth in half year ended Sep 2025 is 5.67% vs 10.62% in Sep 2024
Growth in half year ended Sep 2025 is -17.91% vs 15.05% in Sep 2024
Nine Monthly Results Snapshot (Consolidated) - Dec'25
YoY Growth in nine months ended Dec 2025 is 11.09% vs 18.49% in Dec 2024
YoY Growth in nine months ended Dec 2025 is -8.21% vs 30.22% in Dec 2024
Annual Results Snapshot (Consolidated) - Mar'26
YoY Growth in year ended Mar 2026 is 17.47% vs 18.34% in Mar 2025
YoY Growth in year ended Mar 2026 is 5.75% vs 25.83% in Mar 2025
About Aeroflex Industries Ltd

Company Coordinates


