
Compare Affordable Robo. with Similar Stocks
Dashboard
Low ability to service debt as the company has a high Debt to EBITDA ratio of 3.71 times
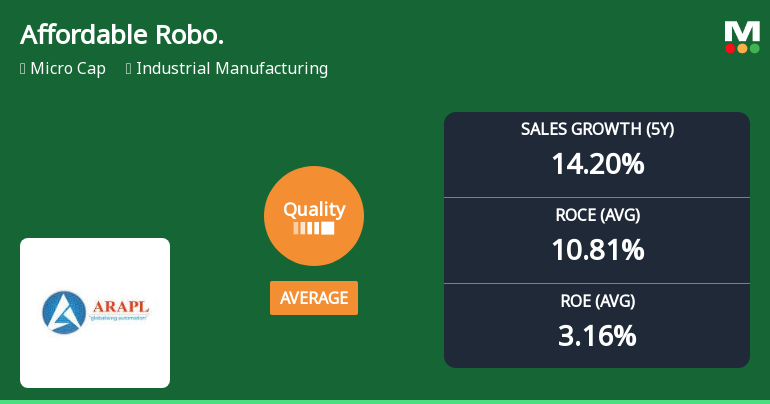
- Poor long term growth as Net Sales has grown by an annual rate of 14.20% over the last 5 years
- Low ability to service debt as the company has a high Debt to EBITDA ratio of 3.71 times
- The company has been able to generate a Return on Equity (avg) of 3.16% signifying low profitability per unit of shareholders funds
Underperformed the market in the last 1 year
Stock DNA
Industrial Manufacturing
INR 210 Cr (Micro Cap)
30.00
35
0.00%
0.56
6.32%
1.91
Total Returns (Price + Dividend) 
Affordable Robo. for the last several years.
Risk Adjusted Returns v/s
Returns Beta

News
Affordable Robotic & Automation Ltd Quality Grade Upgrade Signals Mixed Business Fundamentals
Affordable Robotic & Automation Ltd has seen its quality grade improve from below average to average, reflecting a nuanced shift in its business fundamentals. While key profitability metrics such as return on equity (ROE) and return on capital employed (ROCE) remain modest, the company has demonstrated strong earnings growth and manageable debt levels, prompting a reassessment of its financial health and investment appeal.
Read full news articleAre Affordable Robotic & Automation Ltd latest results good or bad?
Affordable Robotic & Automation Ltd's latest financial results for Q4 FY26 present a mixed picture characterized by significant quarterly volatility. The company reported a net profit of ₹4.78 crores, which reflects a substantial quarter-on-quarter increase of 264.89%, recovering from previous losses. This recovery in profitability is notable, especially when compared to the loss of ₹3.69 crores in Q2 FY26 and a modest profit of ₹1.31 crores in Q3 FY26. However, while the quarterly revenue surged by 155.54% to ₹50.93 crores, this figure represents a decline of 39.67% year-on-year compared to ₹84.42 crores in Q4 FY25, indicating ongoing challenges in sustaining revenue growth. The operating margin improved to 16.06%, up from 15.15% in the previous quarter, suggesting better cost management and project execution. Despite the positive quarterly performance, the company faces significant operational challeng...
Read full news article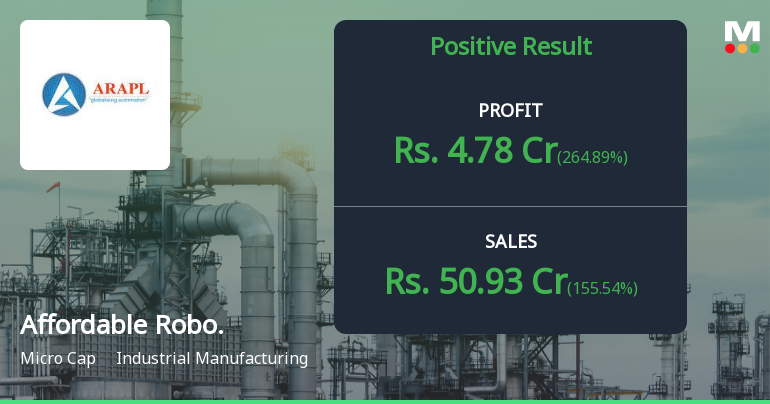
Affordable Robotic & Automation Q4 FY26: Sharp Profit Recovery Masks Persistent Structural Weaknesses
Affordable Robotic & Automation Ltd. (NSE: AFFORDABLE), a micro-cap industrial manufacturing company with a market capitalisation of ₹214.00 crores, reported a sharp quarterly profit recovery in Q4 FY26, with net profit surging 264.89% quarter-on-quarter to ₹4.78 crores. However, the headline numbers conceal deeper concerns as the company continues to grapple with year-on-year revenue declines, anaemic return ratios, and a troubling erosion in promoter confidence reflected in persistent stake reductions.
Read full news article Announcements
Corporate Actions

No Upcoming Board Meetings

No Dividend history available

No Splits history available

No Bonus history available

Affordable Robotic & Automation Ltd has announced 46:439 rights issue, ex-date: 12 Feb 24
Quality key factors
Valuation key factors
Technicals key factors
 Technical Indicator Scale: Bearish, Mildly Bearish, Sideways, Mildly Bullish, Bullish Turned
 Shareholding Snapshot : Apr 2026
Shareholding Compare (%holding)
Non Institution
None
Held by 0 Schemes
Held by 3 FIIs (1.22%)
Milind Manohar Padole (27.74%)
Vijay Kishanlal Kedia (7.01%)
41.9%
Quarterly Results Snapshot (Consolidated) - Mar'26 - QoQ

QoQ Growth in quarter ended Mar 2026 is 155.54% vs -28.92% in Dec 2025
QoQ Growth in quarter ended Mar 2026 is 264.89% vs -71.33% in Dec 2025
Half Yearly Results Snapshot (Consolidated) - Sep'25
Growth in half year ended Sep 2025 is 7.07% vs -63.65% in Sep 2024
Growth in half year ended Sep 2025 is 107.16% vs -192.97% in Sep 2024
Nine Monthly Results Snapshot (Consolidated) - Dec'25
YoY Growth in nine months ended Dec 2025 is -14.59% vs -16.64% in Dec 2024
YoY Growth in nine months ended Dec 2025 is 115.70% vs -594.03% in Dec 2024
Annual Results Snapshot (Consolidated) - Mar'26

YoY Growth in year ended Mar 2026 is -27.61% vs -0.33% in Mar 2025
YoY Growth in year ended Mar 2026 is 159.83% vs -281.18% in Mar 2025
About Affordable Robotic & Automation Ltd

Company Coordinates


