
Compare Affordable Robo. with Similar Stocks
Dashboard
Low ability to service debt as the company has a high Debt to EBITDA ratio of 3.71 times
- Poor long term growth as Net Sales has grown by an annual rate of 14.20% over the last 5 years
- Low ability to service debt as the company has a high Debt to EBITDA ratio of 3.71 times
- The company has been able to generate a Return on Equity (avg) of 3.16% signifying low profitability per unit of shareholders funds
Underperformed the market in the last 1 year
Stock DNA
Industrial Manufacturing
INR 238 Cr (Micro Cap)
32.00
36
0.00%
0.56
6.32%
2.05
Total Returns (Price + Dividend) 
Affordable Robo. for the last several years.
Risk Adjusted Returns v/s
Returns Beta

News
Affordable Robotic & Automation Ltd is Rated Sell
Affordable Robotic & Automation Ltd is rated 'Sell' by MarketsMOJO. This rating was last updated on 25 May 2026, reflecting a shift from a previous 'Strong Sell' stance. However, all fundamentals, returns, and financial metrics discussed here are current as of 15 July 2026, providing investors with an up-to-date view of the stock's position.
Read full news article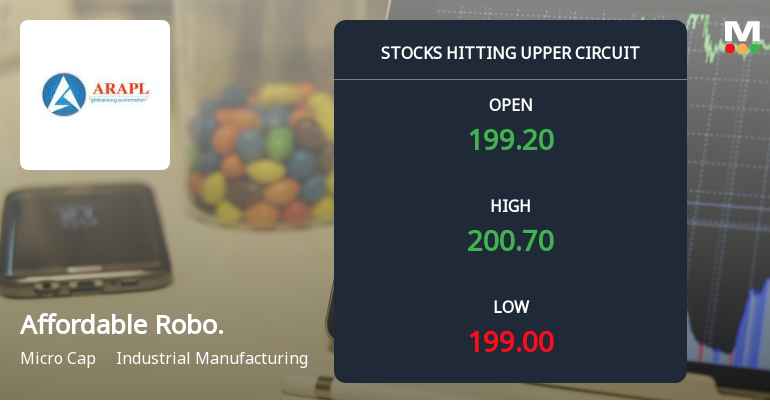
Affordable Robotic & Automation Ltd Locks at Upper Circuit With 5.0% Gain — Buyers Queue, Sellers Absent
At Rs 200.63, the buying was done — not because demand dried up, but because the exchange wouldn't let the stock go any higher. Affordable Robotic & Automation Ltd locked at its upper circuit of 5.0% on 14 Jul 2026, with buyers queuing and no sellers willing to part with shares.
Read full news article
Affordable Robotic & Automation Ltd Locks at Upper Circuit With 5% Gain — Buyers Queue, Sellers Absent
At Rs 191.08, the buying was done — not because demand dried up, but because the exchange wouldn't let the stock go any higher. Affordable Robotic & Automation Ltd locked at its upper circuit of 5% on 14 Jul 2026, with buyers queuing and no sellers willing to part with shares.
Read full news article Announcements
Corporate Actions

17 Jul 2026

No Dividend history available

No Splits history available

No Bonus history available

Affordable Robotic & Automation Ltd has announced 46:439 rights issue, ex-date: 12 Feb 24
Quality key factors
Valuation key factors
Technicals key factors
 Technical Indicator Scale: Bearish, Mildly Bearish, Sideways, Mildly Bullish, Bullish Turned
 Shareholding Snapshot : Apr 2026
Shareholding Compare (%holding)
Non Institution
None
Held by 0 Schemes
Held by 3 FIIs (1.22%)
Milind Manohar Padole (27.74%)
Vijay Kishanlal Kedia (7.01%)
41.9%
Quarterly Results Snapshot (Consolidated) - Mar'26 - QoQ

QoQ Growth in quarter ended Mar 2026 is 155.54% vs -28.92% in Dec 2025
QoQ Growth in quarter ended Mar 2026 is 264.89% vs -71.33% in Dec 2025
Half Yearly Results Snapshot (Consolidated) - Sep'25
Growth in half year ended Sep 2025 is 7.07% vs -63.65% in Sep 2024
Growth in half year ended Sep 2025 is 107.16% vs -192.97% in Sep 2024
Nine Monthly Results Snapshot (Consolidated) - Dec'25
YoY Growth in nine months ended Dec 2025 is -14.59% vs -16.64% in Dec 2024
YoY Growth in nine months ended Dec 2025 is 115.70% vs -594.03% in Dec 2024
Annual Results Snapshot (Consolidated) - Mar'26

YoY Growth in year ended Mar 2026 is -27.61% vs -0.33% in Mar 2025
YoY Growth in year ended Mar 2026 is 159.83% vs -281.18% in Mar 2025
About Affordable Robotic & Automation Ltd

Company Coordinates


