
Compare AG Ventures with Similar Stocks
Dashboard
Weak Long Term Fundamental Strength with a -48.12% CAGR growth in Operating Profits over the last 5 years
- The company has been able to generate a Return on Equity (avg) of 4.62% signifying low profitability per unit of shareholders funds
The company has declared Negative results for the last 3 consecutive quarters
With ROE of 1.9, it has a Very Expensive valuation with a 0.5 Price to Book Value
Falling Participation by Institutional Investors
Consistent Underperformance against the benchmark over the last 3 years
Stock DNA
Commodity Chemicals
INR 125 Cr (Micro Cap)
25.00
43
0.00%
-0.12
1.87%
0.46
Total Returns (Price + Dividend) 
Latest dividend: 7 per share ex-dividend date: Jul-23-2024
Risk Adjusted Returns v/s
Returns Beta

News

AG Ventures Ltd is Rated Strong Sell
AG Ventures Ltd is rated Strong Sell by MarketsMOJO. This rating was last updated on 13 Nov 2025, reflecting a change from the previous 'Sell' grade. However, the analysis and financial metrics discussed here represent the stock's current position as of 16 June 2026, providing investors with the latest insights into the company’s performance and outlook.
Read full news article
AG Ventures Ltd is Rated Strong Sell
AG Ventures Ltd is rated Strong Sell by MarketsMOJO. This rating was last updated on 13 Nov 2025, reflecting a reassessment of the stock’s outlook. However, the analysis and financial metrics presented here are based on the company’s current position as of 02 June 2026, providing investors with the latest insights into its performance and prospects.
Read full news article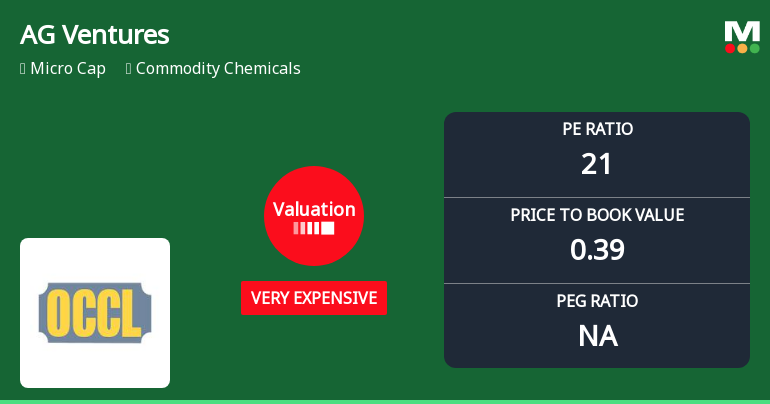
AG Ventures Ltd Valuation Shifts Signal Heightened Price Risk Amid Weak Returns
AG Ventures Ltd, a micro-cap player in the commodity chemicals sector, has seen its valuation parameters shift markedly, raising questions about its price attractiveness amid deteriorating fundamentals and a challenging market backdrop. The company’s price-to-earnings (P/E) ratio now stands at 20.79, categorising it as very expensive relative to its historical averages and peer group, while its price-to-book value (P/BV) remains low at 0.39, signalling a complex valuation narrative for investors to consider.
Read full news article Announcements
Announcement under Regulation 30 (LODR)-Resignation of Chief Financial Officer (CFO)
19-Jun-2026 | Source : BSEIntimation of Resignation of Chief Financial Officer of the Company
Announcement under Regulation 30 (LODR)-Newspaper Publication
29-May-2026 | Source : BSEIn compliance with Regulation 30 of the SEBI (Listing Obligations and Disclosure Requirements) Regulations 2015 please find enclosed copies of notice published on 29th May 2026 in respect of transfer of Equity Shares of the Company to the Investor Education and Protection Fund in accordance with the provisions of Section 124(6) of the Companies Act 2013 read with the Investor Education and Protection Fund Authority (Accounting Audit Transfer and Refund) Rules 2016 as amended from time to time in Business Standards (English Language) nationwide circulation and Business Standards New Delhi Edition- NCR in Hindi language.
Announcement under Regulation 30 (LODR)-Newspaper Publication
29-May-2026 | Source : BSENewspaper Advertisement regarding opening of Special Window for re-lodgement of transfer request of physical shares
Corporate Actions

No Upcoming Board Meetings

AG Ventures Ltd has declared 70% dividend, ex-date: 23 Jul 24

No Splits history available

No Bonus history available

No Rights history available
Quality key factors
Valuation key factors
Technicals key factors
 Technical Indicator Scale: Bearish, Mildly Bearish, Sideways, Mildly Bullish, Bullish Turned
 Shareholding Snapshot : Mar 2026
Shareholding Compare (%holding)
Promoters
None
Held by 2 Schemes (2.67%)
Held by 3 FIIs (0.27%)
Cosmopolitan Investments Private Limited (25.59%)
Hdfc Large And Mid Cap Fund (2.62%)
36.96%
Quarterly Results Snapshot (Consolidated) - Mar'26 - YoY

YoY Growth in quarter ended Mar 2026 is -9.38% vs 18.88% in Mar 2025
YoY Growth in quarter ended Mar 2026 is -103.41% vs -94.36% in Mar 2025
Half Yearly Results Snapshot (Consolidated) - Sep'25
Growth in half year ended Sep 2025 is 0.12% vs 29.01% in Sep 2024

Growth in half year ended Sep 2025 is -56.46% vs -70.78% in Sep 2024
Nine Monthly Results Snapshot (Consolidated) - Dec'25
YoY Growth in nine months ended Dec 2025 is 1.93% vs 39.73% in Dec 2024
YoY Growth in nine months ended Dec 2025 is -46.82% vs -71.18% in Dec 2024
Annual Results Snapshot (Consolidated) - Mar'26
YoY Growth in year ended Mar 2026 is -0.99% vs 33.40% in Mar 2025
YoY Growth in year ended Mar 2026 is -51.58% vs -78.84% in Mar 2025
About AG Ventures Ltd

Company Coordinates


