
Compare Agio Paper with Similar Stocks
Dashboard
With a Negative Book Value, the company has a Weak Long Term Fundamental Strength
- Poor long term growth as Net Sales has grown by an annual rate of % and Operating profit at 0% over the last 5 years
- The company has a negative book value of Rs 15.71 crore
Flat results in Mar 26
Risky - Negative EBITDA
Below par performance in long term as well as near term
Stock DNA
Paper, Forest & Jute Products
INR 6 Cr (Micro Cap)
NA (Loss Making)
17
0.00%
-1.01
114.90%
-0.38
Total Returns (Price + Dividend) 
Agio Paper for the last several years.
Risk Adjusted Returns v/s
Returns Beta

News
Are Agio Paper & Industries Ltd latest results good or bad?
Agio Paper & Industries Ltd's latest financial results for Q4 FY26 reflect a challenging operational landscape. The company reported a net loss of ₹0.40 crores, which is a slight improvement from the ₹0.50 crores loss in the previous quarter, indicating a marginal narrowing of losses. However, the company has not generated any revenue for several consecutive quarters, with net sales reported at ₹0.00 crores, highlighting a complete operational shutdown. The interest burden has increased to ₹0.30 crores, up 3.45% from the previous quarter, which raises concerns about the company's ability to manage its debt obligations given the absence of revenue. Additionally, the company's book value per share stands at a negative ₹16.86, indicating that its liabilities significantly exceed its assets, which places it in a precarious financial position. The operational profit before depreciation, interest, and tax (PBDI...
Read full news article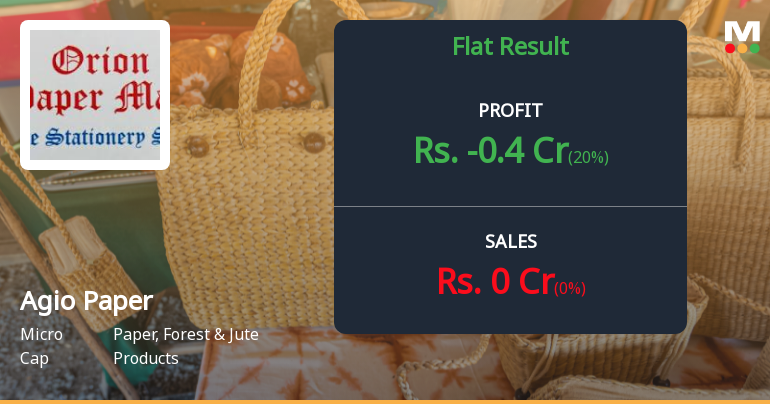
Agio Paper & Industries Q4 FY26: Mounting Losses Signal Deepening Distress
Agio Paper & Industries Ltd., a micro-cap paper manufacturer with a market capitalisation of ₹6.00 crores, reported a net loss of ₹0.40 crores in Q4 FY26, marking its seventh consecutive quarter of losses. The company, which has recorded zero sales for at least the past seven quarters, continues to face mounting operational challenges with employee costs and interest expenses eroding shareholder value. The stock traded at ₹3.94 on May 22, 2026, down 51.95% from its 52-week high of ₹8.20, reflecting investor concerns about the company's deteriorating financial position.
Read full news article Announcements
Announcement under Regulation 30 (LODR)-Newspaper Publication
23-May-2026 | Source : BSENewspaper Publication of Financial Result for Quarter and Year Ended 31.03.2026
Announcement under Regulation 30 (LODR)-Dividend Updates
22-May-2026 | Source : BSEThe Company has not decleared any Dividend for FY 2025-2026
Board Meeting Outcome for Board Meeting Outcome For Outcome Of The Board Meeting Held On Friday May 22 2026
22-May-2026 | Source : BSEPlease find attached outcome of Board meeting held on May 22 2026
Corporate Actions

No Upcoming Board Meetings

No Dividend history available

No Splits history available

No Bonus history available

No Rights history available
Quality key factors
Valuation key factors
Technicals key factors
 Technical Indicator Scale: Bearish, Mildly Bearish, Sideways, Mildly Bullish, Bullish Turned
 Shareholding Snapshot : Mar 2026
Shareholding Compare (%holding)
Promoters
None
Held by 3 Schemes (0.04%)
Held by 0 FIIs
Ankit Jalan (45.34%)
Bharat Mekani (9.3%)
34.7%
Quarterly Results Snapshot (Standalone) - Mar'26 - QoQ
QoQ Growth in quarter ended Mar 2026 is 0.00% vs 0.00% in Dec 2025

QoQ Growth in quarter ended Mar 2026 is 20.00% vs 97.01% in Dec 2025
Half Yearly Results Snapshot (Standalone) - Sep'25
Growth in half year ended Sep 2025 is 0.00% vs 0.00% in Sep 2024
Growth in half year ended Sep 2025 is -2,017.28% vs -19.12% in Sep 2024
Nine Monthly Results Snapshot (Standalone) - Dec'25

YoY Growth in nine months ended Dec 2025 is 0.00% vs -100.00% in Dec 2024
YoY Growth in nine months ended Dec 2025 is -1,383.19% vs -32.22% in Dec 2024
Annual Results Snapshot (Standalone) - Mar'26
YoY Growth in year ended Mar 2026 is 0.00% vs -100.00% in Mar 2025
YoY Growth in year ended Mar 2026 is -1,042.41% vs -46.30% in Mar 2025
About Agio Paper & Industries Ltd

Company Coordinates


