
Compare Agro Phos India with Similar Stocks
Total Returns (Price + Dividend) 
Latest dividend: 1 per share ex-dividend date: Sep-23-2025
Risk Adjusted Returns v/s
Returns Beta

News

Agro Phos India Ltd is Rated Strong Sell
Agro Phos India Ltd is rated Strong Sell by MarketsMOJO, with this rating last updated on 30 May 2026. However, the analysis and financial metrics discussed here reflect the company’s current position as of 17 June 2026, providing investors with the latest insights into its performance and outlook.
Read full news article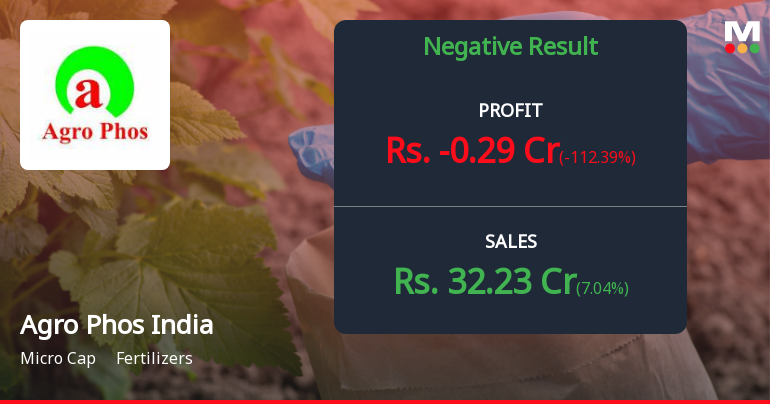
Agro Phos India Q4 FY26: Sharp Profit Decline Raises Concerns Despite Revenue Growth
Agro Phos (India) Limited, a micro-cap fertiliser manufacturer, reported deeply concerning results for Q4 FY26, posting a net loss of ₹0.29 crores against a profit of ₹2.51 crores in the corresponding quarter last year. The sharp 112.39% year-on-year decline in profitability has sent alarm bells ringing amongst investors, with the stock trading at ₹33.09 on May 29, 2026, down 2.13% on the day and languishing 30.48% below its 52-week high of ₹47.60.
Read full news article
Agro Phos India Ltd is Rated Sell
Agro Phos India Ltd is rated 'Sell' by MarketsMOJO, with this rating last updated on 26 May 2026. However, the analysis and financial metrics discussed here reflect the stock's current position as of 29 May 2026, providing investors with the latest insights into its performance and outlook.
Read full news article Announcements
Agro Phos India Limited - Outcome of Board Meeting
13-Nov-2019 | Source : NSEAgro Phos India Limited has informed the Exchange regarding Board meeting held on November 11, 2019.
AGM\/Book Closure
09-Sep-2019 | Source : NSE
| Agro Phos India Limited has informed the Exchange that??the Register of Members and the Share Transfer Books will remain closed from ??from September 23, 2019 to September 30, 2019 (both days inclusive)?? for the purpose of Annual General Meeting to be held on September 30, 2019. |
Shareholders meeting
07-Sep-2019 | Source : NSE
| Agro Phos India Limited has informed the Exchange regarding Notice of Annual General Meeting to be held on September 30, 2019 |
Corporate Actions

No Upcoming Board Meetings

Agro Phos India Ltd has declared 10% dividend, ex-date: 23 Sep 25

No Splits history available

No Bonus history available

No Rights history available
Quality key factors
Valuation key factors
Technicals key factors
 Technical Indicator Scale: Bearish, Mildly Bearish, Sideways, Mildly Bullish, Bullish Turned
 Shareholding Snapshot : Mar 2026
Shareholding Compare (%holding)
Promoters
None
Held by 0 Schemes
Held by 0 FIIs
Raj Kumar Gupta (21.21%)
Preeti Gupta (1.09%)
42.68%
Quarterly Results Snapshot (Consolidated) - Mar'26 - YoY

YoY Growth in quarter ended Mar 2026 is 7.04% vs 994.91% in Mar 2025
YoY Growth in quarter ended Mar 2026 is -112.39% vs 154.80% in Mar 2025
Half Yearly Results Snapshot (Standalone) - Sep'25

Growth in half year ended Sep 2025 is 44.14% vs -38.33% in Sep 2024
Growth in half year ended Sep 2025 is 2,424.00% vs -96.62% in Sep 2024
Nine Monthly Results Snapshot (Standalone) - Dec'25
YoY Growth in nine months ended Dec 2025 is 47.92% vs -22.60% in Dec 2024
YoY Growth in nine months ended Dec 2025 is 161.31% vs 181.07% in Dec 2024
Annual Results Snapshot (Consolidated) - Mar'26
YoY Growth in year ended Mar 2026 is 23.42% vs 15.47% in Mar 2025
YoY Growth in year ended Mar 2026 is 40.08% vs 165.62% in Mar 2025
About Agro Phos India Ltd

Company Coordinates


