
Compare AGS Transact with Similar Stocks
Dashboard
Weak Long Term Fundamental Strength as the company has not declared results in the last 6 months
- Low ability to service debt as the company has a high Debt to EBITDA ratio of 3.71 times
- The company has been able to generate a Return on Equity (avg) of 0.57% signifying low profitability per unit of shareholders funds
With a fall in Net Sales of -40.4%, the company declared Very Negative results in Jan 70
Risky - No result in last 6 months
Stock DNA
Financial Technology (Fintech)
INR 28 Cr (Micro Cap)
NA (Loss Making)
NA
0.00%
1.79
1.72%
0.05
Total Returns (Price + Dividend) 
AGS Transact for the last several years.
Risk Adjusted Returns v/s
Returns Beta

News
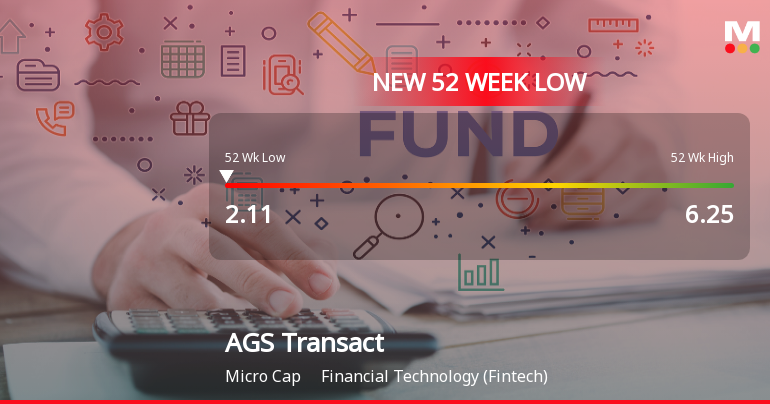
Markets Rally, But AGS Transact Technologies Ltd Sinks to 52-Week Low in Stock-Specific Sell-Off
While the broader market enjoys gains, AGS Transact Technologies Ltd has plunged to a fresh 52-week low of Rs 2.11 on 27 Jul 2026, marking a steep decline of nearly 66% from its peak of Rs 6.25 in the past year. This stark underperformance contrasts sharply with the Sensex’s modest 0.74% rise on the same day, underscoring the stock’s isolated weakness amid a generally positive market environment.
Read full news article
AGS Transact Technologies Ltd is Rated Strong Sell
AGS Transact Technologies Ltd is rated Strong Sell by MarketsMOJO. This rating was last updated on 17 Feb 2025, reflecting a significant reassessment of the stock’s outlook. However, the analysis and financial metrics presented here are based on the company’s current position as of 03 July 2026, providing investors with the latest insights into its performance and prospects.
Read full news article
AGS Transact Technologies Ltd is Rated Strong Sell
AGS Transact Technologies Ltd is rated Strong Sell by MarketsMOJO. This rating was last updated on 17 Feb 2025. However, the analysis and financial metrics discussed below reflect the stock’s current position as of 18 June 2026, providing investors with an up-to-date view of the company’s fundamentals, returns, and market standing.
Read full news article Announcements
Corporate Insolvency Resolution Process (CIRP)-Intimation of meeting of Committee of Creditors
14-Jul-2026 | Source : BSEIntimation of 15th Coc meeting
Compliances-Certificate under Reg. 74 (5) of SEBI (DP) Regulations 2018
14-Jul-2026 | Source : BSEAs enclosed
Closure of Trading Window
01-Jul-2026 | Source : BSEIntimation for closure of trading window
Corporate Actions

No Upcoming Board Meetings

No Dividend history available

No Splits history available

No Bonus history available

No Rights history available
Quality key factors
Valuation key factors
Technicals key factors
 Technical Indicator Scale: Bearish, Mildly Bearish, Sideways, Mildly Bullish, Bullish Turned
 Shareholding Snapshot : Mar 2026
Shareholding Compare (%holding)
Non Institution
None
Held by 1 Schemes (3.57%)
Held by 3 FIIs (0.06%)
Vineha Enterprises Private Limited (20.4%)
Hdfc Trustee Company Ltd. A/c Hdfc Balanced Advantage Fund (3.57%)
63.99%
Quarterly Results Snapshot (Consolidated) - Dec'24 - QoQ

QoQ Growth in quarter ended Dec 2024 is -40.40% vs 3.50% in Sep 2024
QoQ Growth in quarter ended Dec 2024 is -1,380.55% vs 9.53% in Sep 2024
Half Yearly Results Snapshot (Consolidated) - Sep'24

Growth in half year ended Sep 2024 is -7.52% vs -10.04% in Sep 2023
Growth in half year ended Sep 2024 is 148.16% vs -251.07% in Sep 2023
Nine Monthly Results Snapshot (Consolidated) - Dec'24
YoY Growth in nine months ended Dec 2024 is -19.65% vs -10.04% in Dec 2023
YoY Growth in nine months ended Dec 2024 is -118.46% vs -244.54% in Dec 2023
Annual Results Snapshot (Consolidated) - Mar'24
YoY Growth in year ended Mar 2024 is -12.01% vs -5.68% in Mar 2023
YoY Growth in year ended Mar 2024 is -316.69% vs 144.82% in Mar 2023
About AGS Transact Technologies Ltd

Company Coordinates


