
Compare Ahm. Steelcraft with Similar Stocks
Stock DNA
Iron & Steel Products
INR 241 Cr (Micro Cap)
13.00
21
0.00%
0.02
14.16%
1.83
Total Returns (Price + Dividend) 
Latest dividend: 0.5 per share ex-dividend date: Aug-14-2019
Risk Adjusted Returns v/s
Returns Beta

News
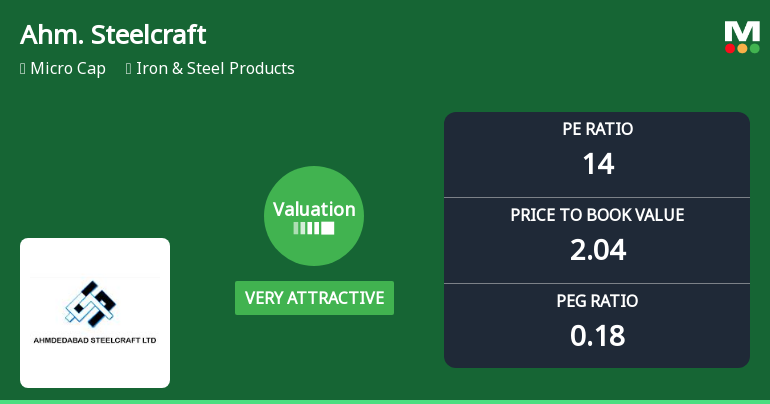
Ahmedabad Steelcraft Ltd Valuation Shifts to Very Attractive Amid Mixed Market Returns
Ahmedabad Steelcraft Ltd has witnessed a significant shift in its valuation parameters, moving from an attractive to a very attractive price range, driven by improved price-to-earnings and price-to-book ratios. This re-rating comes amid a challenging industry backdrop and a mixed performance relative to peers, prompting a reassessment of the stock’s price attractiveness for investors.
Read full news articleAre Ahmedabad Steelcraft Ltd latest results good or bad?
The latest financial results for Ahmedabad Steelcraft Ltd for the quarter ended March 2026 reveal significant operational challenges. The company reported net sales of ₹52.02 crores, reflecting a contraction of 15.96% compared to the previous quarter and a decline of 20.34% year-on-year. This drop in revenue indicates sustained pressure on the company's top-line growth, as it marks the lowest sales figure in recent quarters. Net profit for the same period was ₹3.21 crores, which represents a decrease of 30.37% quarter-on-quarter and an 8.02% decline year-on-year. This decline in profitability is concerning, especially as it coincides with a sharp contraction in operating margins, which fell to 7.79% from 10.34% in the previous quarter. While there was a modest year-on-year improvement in operating margins, the sequential decline raises questions about the company's pricing power and cost management. The c...
Read full news article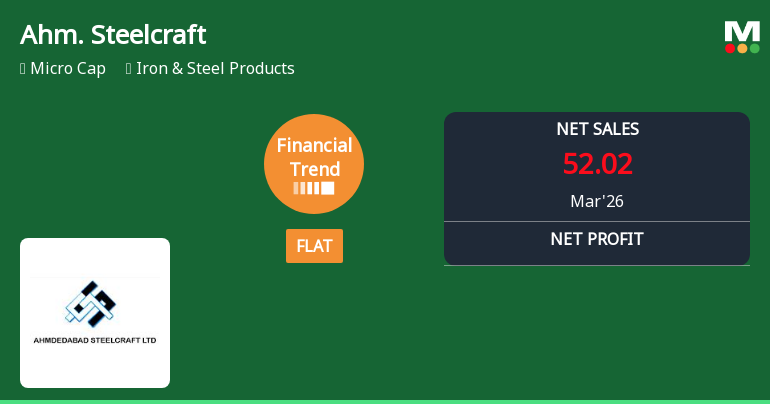
Ahmedabad Steelcraft Ltd Reports Flat Quarterly Performance Amid Margin Pressures
Ahmedabad Steelcraft Ltd, a micro-cap player in the Iron & Steel Products sector, has reported a flat financial performance for the quarter ended March 2026, signalling a notable shift from its previously positive growth trajectory. The company’s latest quarterly results reveal declines in key metrics such as net sales, profit after tax, and earnings per share, prompting a downgrade in its Mojo Grade from Hold to Sell.
Read full news article Announcements
Announcement under Regulation 30 (LODR)-Newspaper Publication
02-Jun-2026 | Source : BSECopy of Newspaper Publication containing extract of Audited financial results for the quarter and year ended on March 31 2026
Board Meeting Outcome for Outcome Of 1St (01/2026-27) Meeting Of Board Of Directors Of The Company Held On May 30 2026
30-May-2026 | Source : BSEThe Board of the directors of the company has considered and approved the standalone Audited financial results for the quarter ended on March 31 2026 along with statements of Assets and liabilities Cash flow Statement as per regulation 33 and Independent Audit Report on Financial Results
Corporate Actions

No Upcoming Board Meetings

Ahmedabad Steelcraft Ltd has declared 5% dividend, ex-date: 14 Aug 19

No Splits history available

No Bonus history available

No Rights history available
Quality key factors
Valuation key factors
Technicals key factors
 Technical Indicator Scale: Bearish, Mildly Bearish, Sideways, Mildly Bullish, Bullish Turned
 Shareholding Snapshot : Mar 2026
Shareholding Compare (%holding)
Promoters
None
Held by 0 Schemes
Held by 0 FIIs
Preeti Punia (24.52%)
Base Engineering Llp (3.64%)
15.99%
Quarterly Results Snapshot (Standalone) - Mar'26 - QoQ

QoQ Growth in quarter ended Mar 2026 is -15.96% vs -4.30% in Dec 2025

QoQ Growth in quarter ended Mar 2026 is -30.37% vs -38.20% in Dec 2025
Half Yearly Results Snapshot (Standalone) - Sep'25
Growth in half year ended Sep 2025 is 179.34% vs 5,551.47% in Sep 2024
Growth in half year ended Sep 2025 is 607.84% vs 266.30% in Sep 2024
Nine Monthly Results Snapshot (Standalone) - Dec'25
YoY Growth in nine months ended Dec 2025 is 58.80% vs 14,302.70% in Dec 2024
YoY Growth in nine months ended Dec 2025 is 113.85% vs 794.23% in Dec 2024
Annual Results Snapshot (Standalone) - Mar'26
YoY Growth in year ended Mar 2026 is 28.74% vs 22,222.08% in Mar 2025
YoY Growth in year ended Mar 2026 is 74.21% vs 567.25% in Mar 2025
About Ahmedabad Steelcraft Ltd

Company Coordinates


