
Compare AIA Engineering with Similar Stocks
Stock DNA
Castings & Forgings
INR 45,597 Cr (Small Cap)
36.00
15
0.33%
-0.55
15.86%
5.65
Total Returns (Price + Dividend) 
Latest dividend: 16 per share ex-dividend date: Sep-04-2025
Risk Adjusted Returns v/s
Returns Beta

News
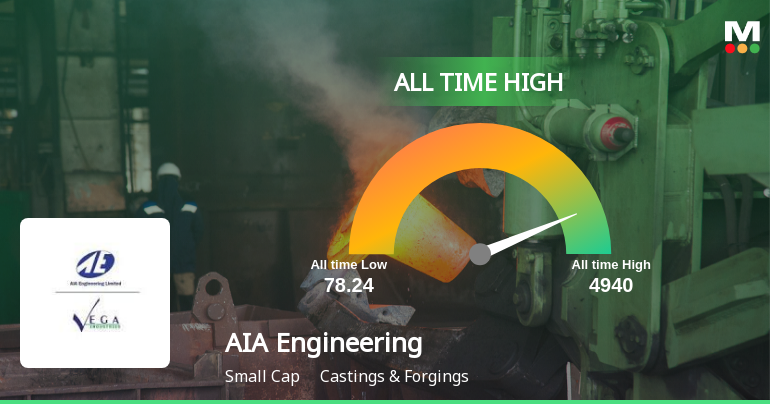
AIA Engineering Ltd Hits All-Time High of Rs 4,925 as Momentum Builds Across Timeframes
Extending its winning streak to eight consecutive sessions, AIA Engineering Ltd surged 2.41% on 23 Jun 2026 to touch a fresh all-time high of Rs 4,925, significantly outpacing the Sensex which inched up just 0.09% on the day.
Read full news article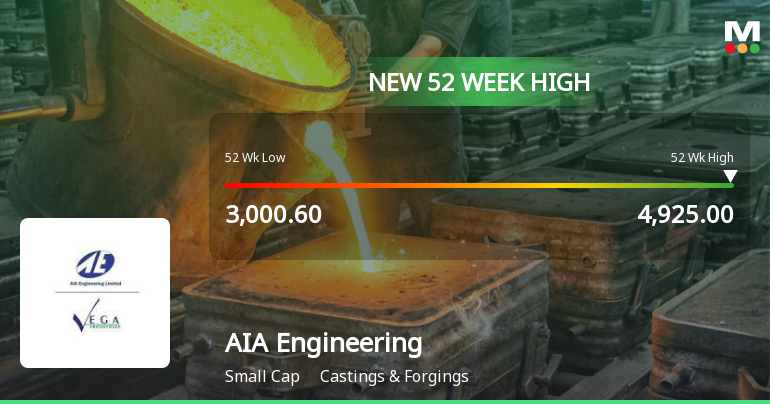
Broad-Based Technical Strength Lifts AIA Engineering Ltd to 52-Week High of Rs 4922.3
With a sustained rally pushing AIA Engineering Ltd to a new 52-week high of Rs 4922.3 on 23 Jun 2026, the stock has demonstrated remarkable price momentum, outpacing its sector and the broader market over the past year.
Read full news article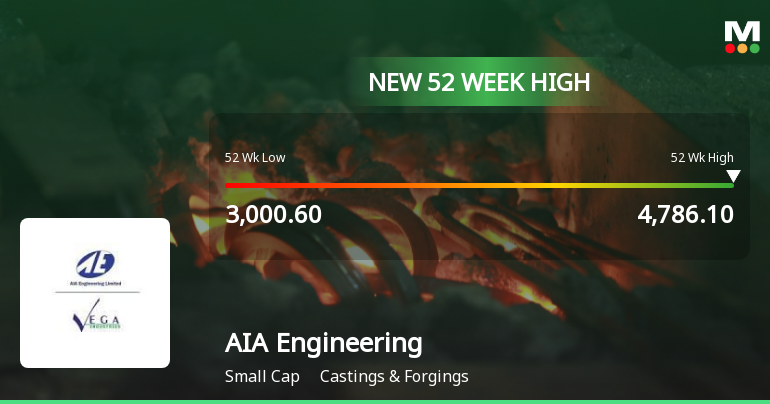
Broad-Based Technical Strength Lifts AIA Engineering Ltd to 52-Week High of Rs 4784
With a sustained seven-day rally culminating in a fresh 52-week high of Rs 4784 on 22 Jun 2026, AIA Engineering Ltd has demonstrated remarkable price momentum, outpacing its sector and the broader market indices.
Read full news article Announcements
AIA Engineering Limited - Other General Purpose
03-Dec-2019 | Source : NSEAIA Engineering Limited has informed the Exchange regarding a copy of disclosure of Related Party Transactions for the half year ended September 30, 2019 pursuant to Regulation 23(9) of the SEBI (Listing Obligations and Disclosure Requirements) Regulations, 2015.á
AIA Engineering Limited - Analysts/Institutional Investor Meet/Con. Call Updates
26-Nov-2019 | Source : NSEAIA Engineering Limited has informed the Exchange regarding Analysts/Institutional Investor Meet/Con. Call Updates
Analysts\/Institutional Investor Meet\/Con. Call Updates
02-Sep-2019 | Source : NSE
| AIA Engineering Limited has informed the Exchange regarding Analysts/Institutional Investor Meet/Con. Call Updates |
Corporate Actions

No Upcoming Board Meetings

AIA Engineering Ltd has declared 800% dividend, ex-date: 04 Sep 25

AIA Engineering Ltd has announced 2:10 stock split, ex-date: 13 Oct 08

No Bonus history available

No Rights history available
Quality key factors
Valuation key factors
Technicals key factors
 Technical Indicator Scale: Bearish, Mildly Bearish, Sideways, Mildly Bullish, Bullish Turned
 Shareholding Snapshot : Mar 2026
Shareholding Compare (%holding)
Promoters
None
Held by 27 Schemes (20.14%)
Held by 219 FIIs (16.79%)
Bhadresh Kantilal Shah (58.47%)
Nalanda India Equity Fund Limited (9.29%)
2.15%
Quarterly Results Snapshot (Consolidated) - Mar'26 - YoY

YoY Growth in quarter ended Mar 2026 is 9.44% vs 0.59% in Mar 2025
YoY Growth in quarter ended Mar 2026 is 37.88% vs 9.47% in Mar 2025
Half Yearly Results Snapshot (Consolidated) - Sep'25
Growth in half year ended Sep 2025 is 1.09% vs -18.55% in Sep 2024
Growth in half year ended Sep 2025 is 12.81% vs -13.29% in Sep 2024
Nine Monthly Results Snapshot (Consolidated) - Dec'25
YoY Growth in nine months ended Dec 2025 is 0.74% vs -15.48% in Dec 2024
YoY Growth in nine months ended Dec 2025 is 13.07% vs -11.37% in Dec 2024
Annual Results Snapshot (Consolidated) - Mar'26
YoY Growth in year ended Mar 2026 is 3.09% vs -11.67% in Mar 2025
YoY Growth in year ended Mar 2026 is 19.74% vs -6.59% in Mar 2025
About AIA Engineering Ltd

Company Coordinates


