
Compare AIMECHATEC Ltd. with Similar Stocks
Total Returns (Price + Dividend) 
TimePeriod
Price Return
Dividend Return
Total Return
3 Months
193.58%
0%
193.58%
6 Months
190.4%
0%
190.4%
1 Year
246.0%
0%
246.0%
2 Years
393.68%
0%
393.68%
3 Years
560.1%
0%
560.1%
4 Years
0%
0%
0.0%
5 Years
0%
0%
0.0%
AIMECHATEC Ltd. for the last several years.
Risk Adjusted Returns v/s
News
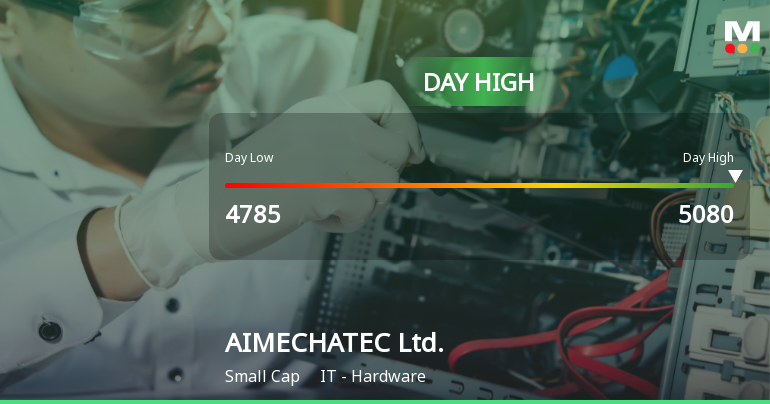
AIMECHATEC Stock Hits Day High with Strong 7.63% Intraday Surge
AIMECHATEC, a small-cap IT hardware company, has experienced notable stock performance, contrasting with the declining Nikkei 225. Over the past year, it has achieved significant growth in stock value and financial metrics, including substantial increases in net sales and operating profit, indicating strong operational health and long-term growth potential.
Read full news article Announcements

No announcement available
Corporate Actions
No corporate action available
Quality key factors
Factor
Value
Sales Growth (5y)
76.99%
EBIT Growth (5y)
100.91%
EBIT to Interest (avg)
13.66
Debt to EBITDA (avg)
4.60
Net Debt to Equity (avg)
0.68
Sales to Capital Employed (avg)
1.00
Tax Ratio
30.91%
Dividend Payout Ratio
82.39%
Pledged Shares
0
Institutional Holding
0
ROCE (avg)
5.22%
ROE (avg)
4.76%
Valuation key factors
Factor
Value
P/E Ratio
23
Industry P/E
Price to Book Value
1.97
EV to EBIT
28.94
EV to EBITDA
21.51
EV to Capital Employed
1.58
EV to Sales
1.52
PEG Ratio
0.12
Dividend Yield
NA
ROCE (Latest)
5.45%
ROE (Latest)
8.55%
Technicals key factors
Indicator
Weekly
Monthly
MACD
Bullish
Bullish
RSI
Bearish
No Signal
Bollinger Bands
Bullish
Bullish
Moving Averages
Bullish (Daily)
KST
Bullish
Bullish
Dow Theory
Bullish
Bullish
OBV
Bullish
No Trend
 Technical Indicator Scale: Bearish, Mildly Bearish, Sideways, Mildly Bullish, Bullish Turned
 Shareholding Snapshot
No data for shareholding present.
Shareholding Compare (%holding)
No data for shareholding present.
Quarterly Results Snapshot (Consolidated) - Jun'25 - YoY
Jun'25
Jun'24
Change(%)
Net Sales
10,397.30
6,567.70
58.31%
Operating Profit (PBDIT) excl Other Income
2,002.80
780.80
156.51%
Interest
34.60
13.70
152.55%
Exceptional Items
-397.10
0.00
Consolidate Net Profit
1,109.20
477.80
132.15%
Operating Profit Margin (Excl OI)
183.50%
108.50%
7.50%
USD in Million.

Net Sales
YoY Growth in quarter ended Jun 2025 is 58.31% vs -14.59% in Jun 2024
Consolidated Net Profit
YoY Growth in quarter ended Jun 2025 is 132.15% vs -20.82% in Jun 2024
Annual Results Snapshot (Consolidated) - Jun'25
Jun'25
Jun'24
Change(%)
Net Sales
21,005.60
15,421.70
36.21%
Operating Profit (PBDIT) excl Other Income
2,509.80
505.20
396.79%
Interest
89.40
51.40
73.93%
Exceptional Items
-1,531.30
0.00
Consolidate Net Profit
337.70
111.70
202.33%
Operating Profit Margin (Excl OI)
99.80%
16.90%
8.29%
USD in Million.
Net Sales
YoY Growth in year ended Jun 2025 is 36.21% vs -0.26% in Jun 2024
Consolidated Net Profit
YoY Growth in year ended Jun 2025 is 202.33% vs -90.64% in Jun 2024
About AIMECHATEC Ltd.

AIMECHATEC Ltd.
IT - Hardware
No Details Available.
Company Coordinates
No Company Details Available
InfinHub Market Technologies FZ-LLC, Building-2, Unit 112, Dubai Internet City, Dubai, United Arab Emirates
GET THE MARKETSMOJO APP


Company
Stocks
Portfolio


"Investment in securities markets are subject to market risk. Read all the related documents carefully before investing."