
Compare Aion-Tech Soluti with Similar Stocks
Dashboard
Weak Long Term Fundamental Strength with a -250.46% CAGR growth in Operating Profits over the last 5 years
- Company's ability to service its debt is weak with a poor EBIT to Interest (avg) ratio of -1.72
- The company has been able to generate a Return on Equity (avg) of 0.28% signifying low profitability per unit of shareholders funds
Flat results in Mar 26
Risky - Negative Operating Profits
Reducing Promoter Confidence
Underperformed the market in the last 1 year
Stock DNA
Computers - Software & Consulting
INR 354 Cr (Micro Cap)
NA (Loss Making)
20
0.00%
0.25
-0.52%
1.15
Total Returns (Price + Dividend) 
Latest dividend: 0.6 per share ex-dividend date: Sep-18-2008
Risk Adjusted Returns v/s
Returns Beta

News

Aion-Tech Solutions Ltd Locks at Lower Circuit With 5.0% Loss — Sellers Queue, No Buyers in Sight
At Rs 64.47, sellers were still queuing — but there were no buyers willing to take the other side. Aion-Tech Solutions Ltd locked at its lower circuit of 5.0% on 3 Jul 2026, with unfilled sell orders and a frozen price.
Read full news article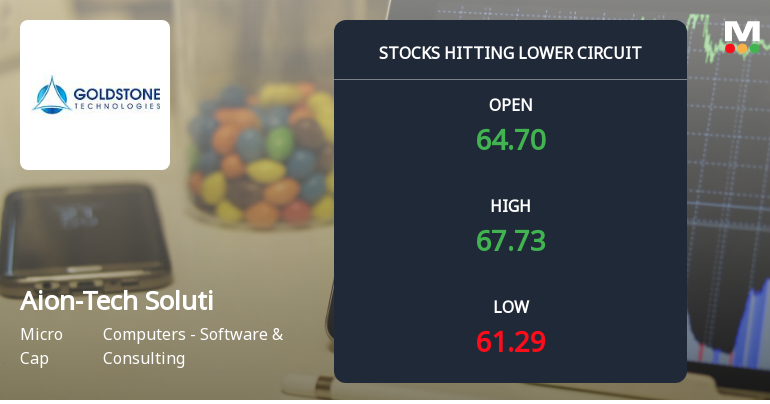
Aion-Tech Solutions Ltd Locks at Lower Circuit With 5% Loss — Sellers Queue, No Buyers in Sight
At Rs 61.64, sellers were still queuing — but there were no buyers willing to take the other side. Aion-Tech Solutions Ltd locked at its lower circuit of 5% on 2 Jul 2026, with unfilled sell orders and a frozen price, signalling a pronounced imbalance in supply and demand.
Read full news article
Aion-Tech Solutions Ltd Upgraded to Sell on Technical Improvement Despite Weak Fundamentals
Aion-Tech Solutions Ltd, a micro-cap player in the Computers - Software & Consulting sector, has seen its investment rating upgraded from Strong Sell to Sell as of 1 July 2026. This change reflects a nuanced shift driven primarily by technical indicators, even as the company’s fundamental and financial metrics remain under pressure. The stock’s recent price surge and improved technical trend contrast with persistent challenges in profitability, valuation, and promoter confidence.
Read full news article Announcements
Closure of Trading Window
25-Jun-2026 | Source : BSEIntimation of Closure of trading Window
Disclosures under Reg. 29(2) of SEBI (SAST) Regulations 2011
15-Jun-2026 | Source : BSEThe Exchange has received the disclosure under Regulation 29(2) of SEBI (Substantial Acquisition of Shares & Takeovers) Regulations 2011 for Trinity Infraventures Ltd & PACs
Disclosures under Reg. 29(2) of SEBI (SAST) Regulations 2011
12-Jun-2026 | Source : BSEThe Exchange has received the disclosure under Regulation 29(2) of SEBI (Substantial Acquisition of Shares & Takeovers) Regulations 2011 for Trinity Infraventures Ltd & PACs
Corporate Actions

No Upcoming Board Meetings

Aion-Tech Solutions Ltd has declared 6% dividend, ex-date: 18 Sep 08

No Splits history available

No Bonus history available

No Rights history available
Quality key factors
Valuation key factors
Technicals key factors
 Technical Indicator Scale: Bearish, Mildly Bearish, Sideways, Mildly Bullish, Bullish Turned
 Shareholding Snapshot : Mar 2026
Shareholding Compare (%holding)
Promoters
3.2403
Held by 0 Schemes
Held by 2 FIIs (6.43%)
Trinity Infraventures Limited (36.25%)
Jayant Hiralal Shah (6.96%)
36.6%
Quarterly Results Snapshot (Consolidated) - Mar'26 - YoY

YoY Growth in quarter ended Mar 2026 is 44.86% vs 24.03% in Mar 2025

YoY Growth in quarter ended Mar 2026 is -54.79% vs 198.65% in Mar 2025
Half Yearly Results Snapshot (Consolidated) - Sep'25
Growth in half year ended Sep 2025 is 38.77% vs -13.23% in Sep 2024
Growth in half year ended Sep 2025 is -20.19% vs 1,948.08% in Sep 2024
Nine Monthly Results Snapshot (Consolidated) - Dec'25
YoY Growth in nine months ended Dec 2025 is 55.26% vs -14.22% in Dec 2024
YoY Growth in nine months ended Dec 2025 is -16.23% vs 737.50% in Dec 2024
Annual Results Snapshot (Consolidated) - Mar'26
YoY Growth in year ended Mar 2026 is 51.89% vs -4.70% in Mar 2025
YoY Growth in year ended Mar 2026 is -18.99% vs 554.13% in Mar 2025
About Aion-Tech Solutions Ltd

Company Coordinates


