
Compare Aion-Tech Soluti with Similar Stocks
Dashboard
Weak Long Term Fundamental Strength with a -250.46% CAGR growth in Operating Profits over the last 5 years
- Company's ability to service its debt is weak with a poor EBIT to Interest (avg) ratio of -1.72
- The company has been able to generate a Return on Equity (avg) of 0.28% signifying low profitability per unit of shareholders funds
Flat results in Mar 26
Risky - Negative Operating Profits
Reducing Promoter Confidence
Underperformed the market in the last 1 year
Stock DNA
Computers - Software & Consulting
INR 220 Cr (Micro Cap)
NA (Loss Making)
20
0.00%
0.25
-0.52%
0.71
Total Returns (Price + Dividend) 
Latest dividend: 0.6 per share ex-dividend date: Sep-18-2008
Risk Adjusted Returns v/s
Returns Beta

News
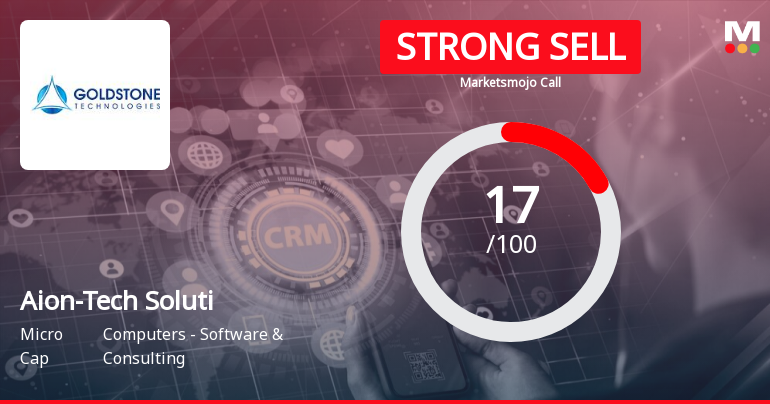
Aion-Tech Solutions Ltd is Rated Strong Sell
Aion-Tech Solutions Ltd is rated Strong Sell by MarketsMOJO, with this rating last updated on 12 Aug 2025. However, the analysis and financial metrics discussed here reflect the company’s current position as of 11 June 2026, providing investors with an up-to-date view of the stock’s fundamentals, valuation, financial trends, and technical outlook.
Read full news articleAre Aion-Tech Solutions Ltd latest results good or bad?
Aion-Tech Solutions Ltd's latest financial results for Q4 FY26 present a complex picture. The company reported a net loss of ₹2.69 crores, contrasting sharply with a profit of ₹0.73 crores in the same quarter last year. This shift in profitability raises concerns about the company's ability to convert its revenue growth into net income. On the positive side, Aion-Tech Solutions achieved a significant year-on-year revenue growth of 44.86%, reaching ₹41.72 crores, which marks the fourth consecutive quarter of double-digit growth. The operating margin, excluding other income, improved to 15.58%, a notable increase from 0.76% in Q4 FY25, indicating enhanced operational efficiency. However, the financial results also highlight significant challenges. Interest costs surged dramatically to ₹2.70 crores, an 18-fold increase from the previous year, reflecting a growing reliance on debt. Additionally, depreciation ...
Read full news article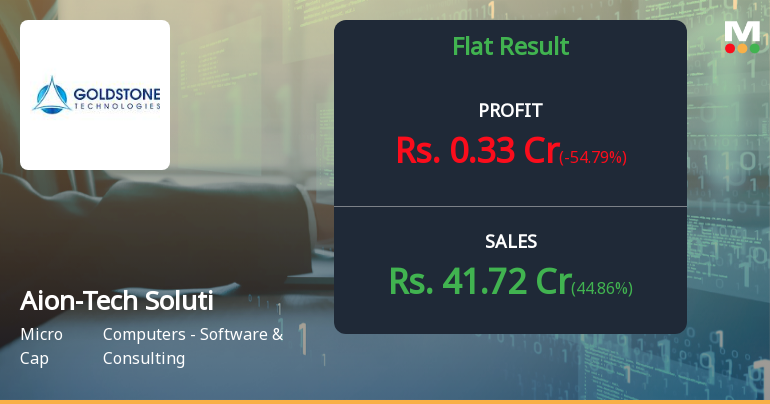
Aion-Tech Solutions Q4 FY26: Losses Mount Despite Revenue Growth as Operational Challenges Deepen
Aion-Tech Solutions Ltd. (formerly Goldstone Technologies Ltd.), a specialist full-stack business intelligence and data analytics consulting firm, reported a consolidated net loss of ₹2.69 crores for Q4 FY26, marking a sharp reversal from the ₹0.73 crore profit recorded in the same quarter last year. Despite net sales climbing 44.86% year-on-year to ₹41.72 crores, the micro-cap IT services company grappled with surging interest costs and elevated depreciation charges that obliterated profitability. The stock, trading at ₹45.14 with a market capitalisation of ₹246.00 crores, has plummeted 35.84% over the past year, significantly underperforming both the broader market and its sector peers.
Read full news article Announcements
Goldstone Technologies Limited - Updates
17-Oct-2019 | Source : NSEGoldstone Technologies Limited has informed the Exchange regarding 'Certificate under Reg74(5) of the SEBI (Depositories Participants) Regulations, 2018:'.
Reply to Clarification- Financial results
05-Sep-2019 | Source : NSE
| The Exchange had sought clarification from Goldstone Technologies Limited for the quarter ended 30-Jun-2019 with respect to Regulation 33 of the SEBI (Listing Obligations and Disclosure Requirements) Regulations, 2015. On basis of above the Company was required to clarify the following: -1. No Segment Reporting. The response of the Company is enclosed. |
Updates
31-Aug-2019 | Source : NSE
| Goldstone Technologies Limited has informed the Exchange regarding 'Newspaper Advertisement confirming dispatch of the Notice of the 25th Annual General Meeting.'. |
Corporate Actions

No Upcoming Board Meetings

Aion-Tech Solutions Ltd has declared 6% dividend, ex-date: 18 Sep 08

No Splits history available

No Bonus history available

No Rights history available
Quality key factors
Valuation key factors
Technicals key factors
 Technical Indicator Scale: Bearish, Mildly Bearish, Sideways, Mildly Bullish, Bullish Turned
 Shareholding Snapshot : Mar 2026
Shareholding Compare (%holding)
Promoters
3.2403
Held by 0 Schemes
Held by 2 FIIs (6.43%)
Trinity Infraventures Limited (36.25%)
Jayant Hiralal Shah (6.96%)
36.6%
Quarterly Results Snapshot (Consolidated) - Mar'26 - YoY

YoY Growth in quarter ended Mar 2026 is 44.86% vs 24.03% in Mar 2025

YoY Growth in quarter ended Mar 2026 is -54.79% vs 198.65% in Mar 2025
Half Yearly Results Snapshot (Consolidated) - Sep'25
Growth in half year ended Sep 2025 is 38.77% vs -13.23% in Sep 2024
Growth in half year ended Sep 2025 is -20.19% vs 1,948.08% in Sep 2024
Nine Monthly Results Snapshot (Consolidated) - Dec'25
YoY Growth in nine months ended Dec 2025 is 55.26% vs -14.22% in Dec 2024
YoY Growth in nine months ended Dec 2025 is -16.23% vs 737.50% in Dec 2024
Annual Results Snapshot (Consolidated) - Mar'26
YoY Growth in year ended Mar 2026 is 51.89% vs -4.70% in Mar 2025
YoY Growth in year ended Mar 2026 is -18.99% vs 554.13% in Mar 2025
About Aion-Tech Solutions Ltd

Company Coordinates


