
Key Events This Week
13 Jul: Stock hits upper circuit at Rs.63.99 (+4.99%) amid strong buying
14 Jul: Mojo Grade upgraded from Strong Sell to Sell on technical improvements
17 Jul: Week closes at Rs.56.57, down 6.65% from previous Friday
Jul 20, 03:30 PM
BSE+NSE Vol: 28.53 k
Computers - Software & Consulting
INR 286 Cr (Micro Cap)
NA (Loss Making)
20
0.00%
0.25
-0.52%
0.97
Latest dividend: 0.6 per share ex-dividend date: Sep-18-2008

13 Jul: Stock hits upper circuit at Rs.63.99 (+4.99%) amid strong buying
14 Jul: Mojo Grade upgraded from Strong Sell to Sell on technical improvements
17 Jul: Week closes at Rs.56.57, down 6.65% from previous Friday
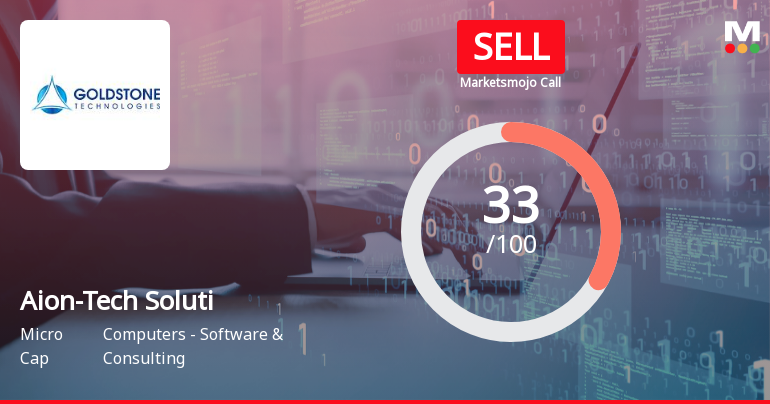
Aion-Tech Solutions Ltd, a micro-cap player in the Computers - Software & Consulting sector, has seen its investment rating upgraded from Strong Sell to Sell as of 13 July 2026. This change is primarily driven by a shift in technical indicators, even as the company continues to grapple with weak financial fundamentals and valuation concerns. The nuanced upgrade reflects a complex interplay of quality, valuation, financial trends, and technical factors that investors should carefully consider.
Read full news article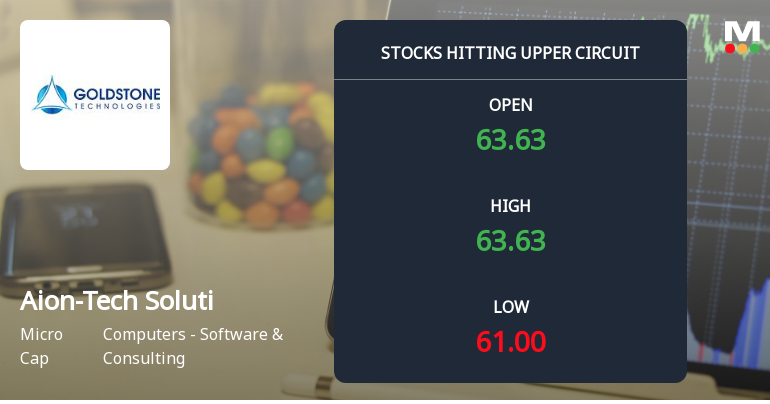
At Rs 63.99, the buying was done — not because demand dried up, but because the exchange wouldn't let the stock go any higher. Aion-Tech Solutions Ltd locked at its upper circuit of 5.0% on 13 Jul 2026, with buyers queuing and no sellers willing to part with shares.
Read full news articleGoldstone Technologies Limited has informed the Exchange regarding 'Certificate under Reg74(5) of the SEBI (Depositories Participants) Regulations, 2018:'.
| The Exchange had sought clarification from Goldstone Technologies Limited for the quarter ended 30-Jun-2019 with respect to Regulation 33 of the SEBI (Listing Obligations and Disclosure Requirements) Regulations, 2015. On basis of above the Company was required to clarify the following: -1. No Segment Reporting. The response of the Company is enclosed. |
| Goldstone Technologies Limited has informed the Exchange regarding 'Newspaper Advertisement confirming dispatch of the Notice of the 25th Annual General Meeting.'. |

No Upcoming Board Meetings

Aion-Tech Solutions Ltd has declared 6% dividend, ex-date: 18 Sep 08

No Splits history available

No Bonus history available

No Rights history available
 Technical Indicator Scale: Bearish, Mildly Bearish, Sideways, Mildly Bullish, Bullish Turned
 Promoters
3.2403
Held by 0 Schemes
Held by 2 FIIs (6.43%)
Trinity Infraventures Limited (36.25%)
Jayant Hiralal Shah (6.96%)
36.51%

YoY Growth in quarter ended Mar 2026 is 44.86% vs 24.03% in Mar 2025

YoY Growth in quarter ended Mar 2026 is -54.79% vs 198.65% in Mar 2025
Growth in half year ended Sep 2025 is 38.77% vs -13.23% in Sep 2024
Growth in half year ended Sep 2025 is -20.19% vs 1,948.08% in Sep 2024
YoY Growth in nine months ended Dec 2025 is 55.26% vs -14.22% in Dec 2024
YoY Growth in nine months ended Dec 2025 is -16.23% vs 737.50% in Dec 2024
YoY Growth in year ended Mar 2026 is 51.89% vs -4.70% in Mar 2025
YoY Growth in year ended Mar 2026 is -18.99% vs 554.13% in Mar 2025


