
Compare AKG Exim with Similar Stocks
Dashboard
Weak Long Term Fundamental Strength with a -50.34% CAGR growth in Operating Profits over the last 5 years
- Company's ability to service its debt is weak with a poor EBIT to Interest (avg) ratio of 1.58
- The company has been able to generate a Return on Equity (avg) of 3.60% signifying low profitability per unit of shareholders funds
The company has declared Negative results for the last 9 consecutive quarters
Below par performance in long term as well as near term
Total Returns (Price + Dividend) 
AKG Exim for the last several years.
Risk Adjusted Returns v/s
Returns Beta

News
AKG Exim Ltd is Rated Strong Sell
AKG Exim Ltd is rated Strong Sell by MarketsMOJO, with this rating last updated on 20 March 2026. However, the analysis and financial metrics discussed here reflect the stock’s current position as of 02 July 2026, providing investors with the latest insights into the company’s performance and outlook.
Read full news article
AKG Exim Ltd is Rated Strong Sell
AKG Exim Ltd is rated Strong Sell by MarketsMOJO, with this rating last updated on 20 March 2026. However, the analysis and financial metrics discussed below reflect the company’s current position as of 19 June 2026, providing investors with the most up-to-date perspective on the stock’s fundamentals, valuation, financial trend, and technical outlook.
Read full news article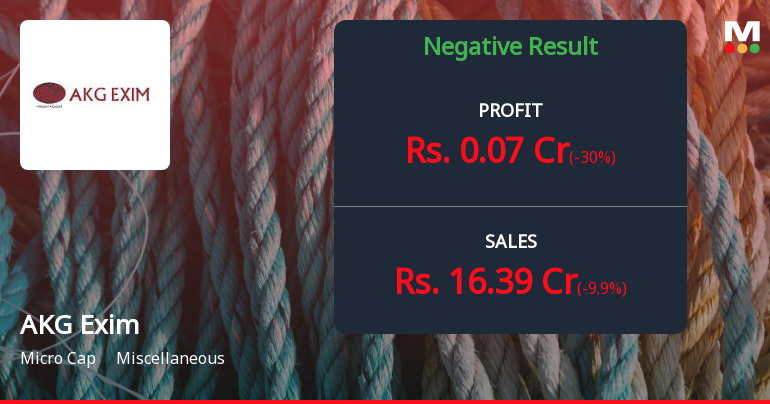
AKG Exim Q4 FY26: Revenue Decline Deepens as Margins Collapse
AKG Exim Ltd., a Delhi-based international commodity trading house, reported deeply concerning fourth-quarter results for FY26, with net profit collapsing by 74.07% year-on-year to just ₹0.07 crores. The micro-cap company, with a market capitalisation of ₹35.00 crores, saw revenues plunge 44.55% YoY to ₹16.39 crores in Q4 FY26, marking the lowest quarterly sales figure in recent history. Operating margins turned wafer-thin at 1.46%, whilst PAT margins compressed to 0.43%, reflecting severe stress across the trading business. The stock has declined 25.31% over the past year, significantly underperforming both the Sensex and its sector peers.
Read full news article Announcements
Akg Exim Limited - Reply to Clarification- Financial results
05-Dec-2019 | Source : NSEAkg Exim Limited Limited for the quarter ended 30-Sep-2019 with respect to Regulation 33 of the SEBI (Listing Obligations and Disclosure Requirements) Regulations, 2015.
Akg Exim Limited - Clarification - Financial Results
03-Dec-2019 | Source : NSEAkg Exim Limited for the quarter ended 30-Sep-2019 with respect to Regulation 33 of the SEBI (Listing Obligations and Disclosure Requirements) Regulations, 2015.
Corporate Actions

No Upcoming Board Meetings

No Dividend history available

No Splits history available

AKG Exim Ltd has announced 3:5 bonus issue, ex-date: 07 Dec 20

AKG Exim Ltd has announced 2:1 rights issue, ex-date: 16 Dec 22
Quality key factors
Valuation key factors
Technicals key factors
 Technical Indicator Scale: Bearish, Mildly Bearish, Sideways, Mildly Bullish, Bullish Turned
 Shareholding Snapshot : Mar 2026
Shareholding Compare (%holding)
Non Institution
None
Held by 0 Schemes
Held by 3 FIIs (1.49%)
Mahima Goel (37.39%)
Kalapi Vinit Nagada (13.09%)
55.03%
Quarterly Results Snapshot (Consolidated) - Mar'26 - QoQ

QoQ Growth in quarter ended Mar 2026 is -9.90% vs -21.70% in Dec 2025

QoQ Growth in quarter ended Mar 2026 is -30.00% vs -9.09% in Dec 2025
Half Yearly Results Snapshot (Consolidated) - Sep'25
Growth in half year ended Sep 2025 is -30.14% vs -20.02% in Sep 2024
Growth in half year ended Sep 2025 is -50.00% vs -54.76% in Sep 2024
Nine Monthly Results Snapshot (Consolidated) - Dec'25
YoY Growth in nine months ended Dec 2025 is -32.54% vs -24.52% in Dec 2024
YoY Growth in nine months ended Dec 2025 is -45.28% vs -60.15% in Dec 2024
Annual Results Snapshot (Consolidated) - Mar'26
YoY Growth in year ended Mar 2026 is -34.62% vs -27.51% in Mar 2025
YoY Growth in year ended Mar 2026 is -58.14% vs -46.58% in Mar 2025
About AKG Exim Ltd

Company Coordinates


