
Compare Akshar Spintex with Similar Stocks
Dashboard
Weak Long Term Fundamental Strength with a -207.06% CAGR growth in Operating Profits over the last 5 years
- Company's ability to service its debt is weak with a poor EBIT to Interest (avg) ratio of -2.97
- The company has been able to generate a Return on Equity (avg) of 3.76% signifying low profitability per unit of shareholders funds
Risky - Negative EBITDA
Stock DNA
Garments & Apparels
INR 39 Cr (Micro Cap)
NA (Loss Making)
23
0.00%
0.05
-8.70%
0.46
Total Returns (Price + Dividend) 
Latest dividend: 0.01 per share ex-dividend date: Jan-04-2024
Risk Adjusted Returns v/s
Returns Beta

News

Akshar Spintex Ltd Upgraded to Sell on Improved Financial and Technical Trends
Akshar Spintex Ltd, a micro-cap player in the Garments & Apparels sector, has seen its investment rating upgraded from Strong Sell to Sell as of 22 May 2026. This change reflects notable improvements in the company’s financial performance and technical indicators, despite lingering concerns over long-term fundamentals and valuation risks.
Read full news article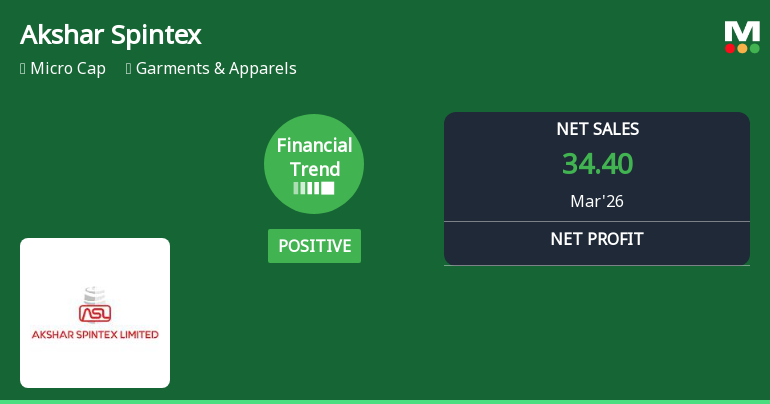
Akshar Spintex Ltd Reports Positive Financial Turnaround in Q4 FY26 Amid Persistent Market Challenges
Akshar Spintex Ltd, a micro-cap player in the Garments & Apparels sector, has reported a notable improvement in its financial performance for the quarter ended March 2026. After a prolonged period of negative trends, the company’s latest quarterly results reveal a positive shift in revenue growth and margin expansion, signalling a potential turnaround despite ongoing challenges in the broader market and its micro-cap status.
Read full news article Announcements
Corporate Actions

No Upcoming Board Meetings

Akshar Spintex Ltd has declared 1% dividend, ex-date: 04 Jan 24

Akshar Spintex Ltd has announced 1:10 stock split, ex-date: 31 Jul 23

Akshar Spintex Ltd has announced 1:5 bonus issue, ex-date: 15 Feb 24

Akshar Spintex Ltd has announced 13:8 rights issue, ex-date: 23 Aug 24
Quality key factors
Valuation key factors
Technicals key factors
 Technical Indicator Scale: Bearish, Mildly Bearish, Sideways, Mildly Bullish, Bullish Turned
 Shareholding Snapshot : Mar 2026
Shareholding Compare (%holding)
Non Institution
None
Held by 0 Schemes
Held by 0 FIIs
Harikrushna Shamjibhai Chauhan (0.11%)
Abhijeet Agarwal (3.52%)
94.17%
Quarterly Results Snapshot (Standalone) - Mar'26 - QoQ

QoQ Growth in quarter ended Mar 2026 is 0.15% vs 53.76% in Dec 2025

QoQ Growth in quarter ended Mar 2026 is 89.74% vs -92.89% in Dec 2025
Half Yearly Results Snapshot (Standalone) - Sep'25
Growth in half year ended Sep 2025 is -19.40% vs -26.59% in Sep 2024
Growth in half year ended Sep 2025 is -229.90% vs -153.89% in Sep 2024
Nine Monthly Results Snapshot (Standalone) - Dec'25
YoY Growth in nine months ended Dec 2025 is -3.83% vs -32.05% in Dec 2024
YoY Growth in nine months ended Dec 2025 is -112.12% vs -232.00% in Dec 2024
Annual Results Snapshot (Standalone) - Mar'26
YoY Growth in year ended Mar 2026 is 0.44% vs -33.26% in Mar 2025
YoY Growth in year ended Mar 2026 is -66.07% vs -228.61% in Mar 2025
About Akshar Spintex Ltd

Company Coordinates


