
Compare AksharChem (I) with Similar Stocks
Dashboard
Weak Long Term Fundamental Strength with a -51.13% CAGR growth in Operating Profits over the last 5 years
- Company's ability to service its debt is weak with a poor EBIT to Interest (avg) ratio of 1.69
- The company has been able to generate a Return on Equity (avg) of 2.40% signifying low profitability per unit of shareholders funds
Flat results in Mar 26
Underperformed the market in the last 1 year
Stock DNA
Dyes And Pigments
INR 189 Cr (Micro Cap)
NA (Loss Making)
22
0.30%
0.25
-0.81%
0.72
Total Returns (Price + Dividend) 
Latest dividend: 0.7 per share ex-dividend date: Sep-04-2025
Risk Adjusted Returns v/s
Returns Beta

News
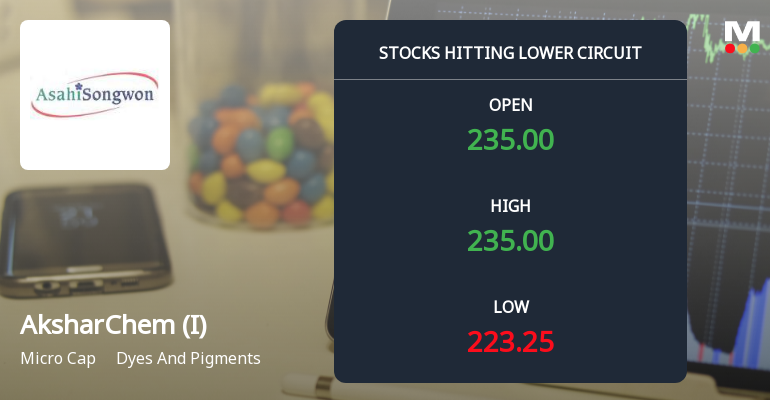
AksharChem (India) Ltd Locks at Lower Circuit With 5.0% Loss — Sellers Queue, No Buyers in Sight
At Rs 223.25, sellers were still queuing — but there were no buyers willing to take the other side. AksharChem (India) Ltd locked at its lower circuit of 5.0% on 20 Jul 2026, with unfilled sell orders and a frozen price, reflecting persistent selling pressure in a micro-cap stock with limited liquidity.
Read full news article
AksharChem (India) Ltd is Rated Strong Sell
AksharChem (India) Ltd is rated Strong Sell by MarketsMOJO, with this rating last updated on 06 July 2026. However, the analysis and financial metrics presented here reflect the stock’s current position as of 18 July 2026, providing investors with an up-to-date view of the company’s fundamentals, returns, and market performance.
Read full news article
AksharChem (India) Ltd Downgraded to Strong Sell Amid Weak Fundamentals and Bearish Technicals
AksharChem (India) Ltd, a micro-cap player in the Dyes and Pigments sector, has seen its investment rating downgraded from Sell to Strong Sell by MarketsMOJO as of 6 July 2026. This revision reflects deteriorating technical indicators, stagnant financial trends, weak quality metrics, and an attractive yet cautionary valuation. The downgrade signals heightened risk for investors amid persistent underperformance and bearish momentum.
Read full news article Announcements
AksharChem India Limited - Limited Review Report
13-Nov-2019 | Source : NSEAksharChem India Limited has informed the Exchange regarding Limited Review Report for the Quarter ended September 30, 2019
AksharChem India Limited - Updates
18-Oct-2019 | Source : NSEAksharChem India Limited has informed the Exchange regarding 'Shutdown of Vinyl Sulphone Plant for repairs and maintenance'.
Shareholders meeting
09-Sep-2019 | Source : NSE
| AksharChem India Limited has informed the Exchange regarding Notice of Annual General Meeting to be held on September 30, 2019 |
Corporate Actions

No Upcoming Board Meetings

AksharChem (India) Ltd has declared 7% dividend, ex-date: 04 Sep 25

No Splits history available

No Bonus history available

No Rights history available
Quality key factors
Valuation key factors
Technicals key factors
 Technical Indicator Scale: Bearish, Mildly Bearish, Sideways, Mildly Bullish, Bullish Turned
 Shareholding Snapshot : Jun 2026
Shareholding Compare (%holding)
Promoters
None
Held by 1 Schemes (0.06%)
Held by 0 FIIs
Mrugesh Jaykrishna Family Trust - 2 (38.87%)
Tarak V Vora (2.31%)
27.18%
Quarterly Results Snapshot (Standalone) - Mar'26 - QoQ

QoQ Growth in quarter ended Mar 2026 is 31.61% vs -9.99% in Dec 2025
QoQ Growth in quarter ended Mar 2026 is 204.76% vs -237.23% in Dec 2025
Half Yearly Results Snapshot (Standalone) - Sep'25

Growth in half year ended Sep 2025 is 12.99% vs 13.70% in Sep 2024
Growth in half year ended Sep 2025 is -130.14% vs 116.87% in Sep 2024
Nine Monthly Results Snapshot (Standalone) - Dec'25
YoY Growth in nine months ended Dec 2025 is 4.35% vs 16.01% in Dec 2024
YoY Growth in nine months ended Dec 2025 is -256.21% vs 126.72% in Dec 2024
Annual Results Snapshot (Standalone) - Mar'26
YoY Growth in year ended Mar 2026 is 7.55% vs 14.64% in Mar 2025
YoY Growth in year ended Mar 2026 is -109.22% vs 125.54% in Mar 2025
About AksharChem (India) Ltd

Company Coordinates


