
Compare Alfa Ica (I) with Similar Stocks
Dashboard
Weak Long Term Fundamental Strength with an average Return on Capital Employed (ROCE) of 7.86%
- Poor long term growth as Net Sales has grown by an annual rate of 9.45% and Operating profit at 1.78% over the last 5 years
- Low ability to service debt as the company has a high Debt to EBITDA ratio of 4.15 times
Flat results in Mar 26
Stock DNA
Plastic Products - Industrial
INR 32 Cr (Micro Cap)
17.00
223
0.00%
0.66
7.56%
1.28
Total Returns (Price + Dividend) 
Latest dividend: 1 per share ex-dividend date: Aug-28-2019
Risk Adjusted Returns v/s
Returns Beta

News

Alfa Ica (India) Ltd Upgraded to Sell on Technical Improvements Despite Weak Fundamentals
Alfa Ica (India) Ltd, a micro-cap player in the Plastic Products - Industrial sector, has seen its investment rating upgraded from Strong Sell to Sell as of 8 June 2026. This change reflects a nuanced shift in the company’s technical outlook, even as fundamental challenges persist. The upgrade is primarily driven by improvements in technical indicators, while valuation and financial trends remain mixed, underscoring the complex investment case for this stock.
Read full news article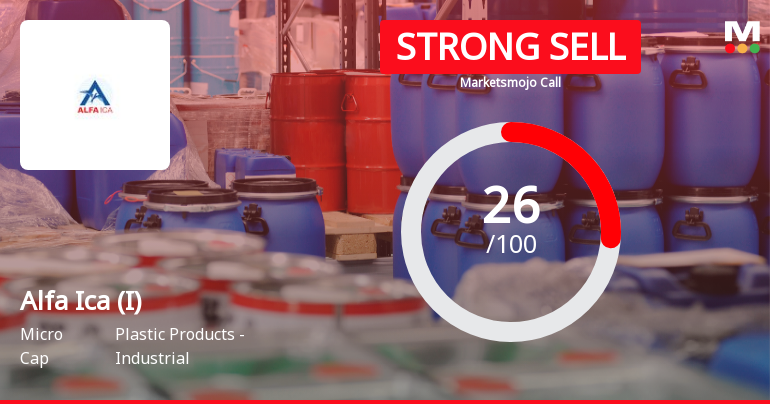
Alfa Ica (India) Ltd Downgraded to Strong Sell Amid Weak Technicals and Financial Trends
Alfa Ica (India) Ltd, a micro-cap player in the Plastic Products - Industrial sector, has seen its investment rating downgraded from Sell to Strong Sell as of 2 June 2026. The revision reflects deteriorating technical indicators, stagnant financial performance, and weak fundamental metrics, signalling caution for investors amid a challenging market environment.
Read full news article
Alfa Ica (India) Ltd is Rated Sell
Alfa Ica (India) Ltd is rated 'Sell' by MarketsMOJO, with this rating last updated on 11 May 2026. However, the analysis and financial metrics discussed here reflect the stock's current position as of 27 May 2026, providing investors with an up-to-date view of the company’s fundamentals, returns, and technical outlook.
Read full news article Announcements
Newspaper Advertisement
29-May-2026 | Source : BSETransfer of unclaimed dividend and share to IEPF as per sec 125 of companies act
Announcement under Regulation 30 (LODR)-Newspaper Publication
22-May-2026 | Source : BSEDeclaration of financial result for year ended on 31st march2026
Board Meeting Outcome for Revised Outcome
20-May-2026 | Source : BSERevised outcome
Corporate Actions

No Upcoming Board Meetings

Alfa Ica (India) Ltd has declared 10% dividend, ex-date: 28 Aug 19

No Splits history available

No Bonus history available

No Rights history available
Quality key factors
Valuation key factors
Technicals key factors
 Technical Indicator Scale: Bearish, Mildly Bearish, Sideways, Mildly Bullish, Bullish Turned
 Shareholding Snapshot : Mar 2026
Shareholding Compare (%holding)
Promoters
None
Held by 0 Schemes
Held by 0 FIIs
Tikmani Ranjendra Hemraj (24.74%)
Saroj Jugalkishor Maheshwari (1.27%)
18.06%
Quarterly Results Snapshot (Standalone) - Mar'26 - QoQ

QoQ Growth in quarter ended Mar 2026 is 16.82% vs 16.81% in Dec 2025
QoQ Growth in quarter ended Mar 2026 is 43.59% vs -13.33% in Dec 2025
Half Yearly Results Snapshot (Standalone) - Sep'25

Growth in half year ended Sep 2025 is 1.69% vs 12.22% in Sep 2024
Growth in half year ended Sep 2025 is 5.56% vs 23.29% in Sep 2024
Nine Monthly Results Snapshot (Standalone) - Dec'25
YoY Growth in nine months ended Dec 2025 is 4.38% vs 16.12% in Dec 2024
YoY Growth in nine months ended Dec 2025 is 272.22% vs -66.97% in Dec 2024
Annual Results Snapshot (Standalone) - Mar'26
YoY Growth in year ended Mar 2026 is 10.29% vs 14.70% in Mar 2025
YoY Growth in year ended Mar 2026 is 31.94% vs -14.29% in Mar 2025
About Alfa Ica (India) Ltd

Company Coordinates


