
Compare Alfa Transformer with Similar Stocks
Dashboard
Weak Long Term Fundamental Strength with an average Return on Capital Employed (ROCE) of 4.62%
- Poor long term growth as Net Sales has grown by an annual rate of 12.30% and Operating profit at 16.23% over the last 5 years
- Company's ability to service its debt is weak with a poor EBIT to Interest (avg) ratio of -0.21
Flat results in Dec 25
Underperformed the market in the last 1 year
Stock DNA
Other Electrical Equipment
INR 43 Cr (Micro Cap)
NA (Loss Making)
47
0.00%
0.39
-0.47%
1.98
Total Returns (Price + Dividend) 
Latest dividend: 1 per share ex-dividend date: Jul-26-2010
Risk Adjusted Returns v/s
Returns Beta

News

Alfa Transformers Ltd is Rated Strong Sell
Alfa Transformers Ltd is rated Strong Sell by MarketsMOJO, with this rating last updated on 12 Feb 2025. However, the analysis and financial metrics discussed here reflect the company’s current position as of 18 June 2026, providing investors with an up-to-date view of its fundamentals, valuation, financial trends, and technical outlook.
Read full news article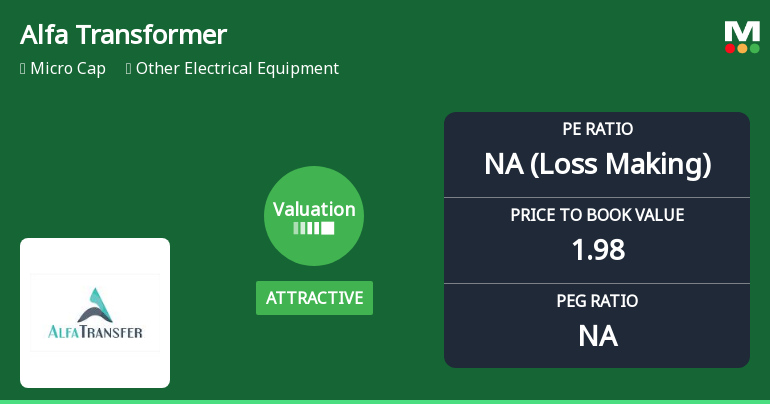
Alfa Transformers Ltd Valuation Shifts Signal Renewed Price Attractiveness
Alfa Transformers Ltd has witnessed a notable shift in its valuation parameters, moving from a fair to an attractive price level, despite ongoing challenges in profitability and market sentiment. This revaluation comes amid a backdrop of mixed financial metrics and a micro-cap status, prompting investors to reassess the stock’s price attractiveness relative to its peers and historical benchmarks.
Read full news article
Alfa Transformers Ltd is Rated Strong Sell
Alfa Transformers Ltd is rated Strong Sell by MarketsMOJO, with this rating last updated on 12 Feb 2025. However, the analysis and financial metrics discussed here reflect the company’s current position as of 08 June 2026, providing investors with an up-to-date view of the stock’s fundamentals, valuation, financial trends, and technical outlook.
Read full news article Announcements
Revised Audited Balance Sheet For The Quarter And Year Ended 31St March2026.
11-Jun-2026 | Source : BSERevised audited balance sheet for the quarter and year ended 31st March2026
Announcement under Regulation 30 (LODR)-Award_of_Order_Receipt_of_Order
10-Jun-2026 | Source : BSECompany has received contract for Supply of different rating of 11 KV of 478 no of Transformer @Rs. 149327.82 per unit total order price is Rs.7.14 Crores from Madhya Gujarat Vij Company Ltd dated 08.06.2026
Purchase Of 1000 Equity Shares On Market Dated 02.06.2026 By GEETISHREE DAS One Of The Promoter Of Target Company.
04-Jun-2026 | Source : BSEPurchase of 1000 equity shares on Market dated 02.06.2026 by GEETISHREE DAS one of the promoter of Target Company
Corporate Actions

No Upcoming Board Meetings

Alfa Transformers Ltd has declared 10% dividend, ex-date: 26 Jul 10

No Splits history available

No Bonus history available

No Rights history available
Quality key factors
Valuation key factors
Technicals key factors
 Technical Indicator Scale: Bearish, Mildly Bearish, Sideways, Mildly Bullish, Bullish Turned
 Shareholding Snapshot : Mar 2026
Shareholding Compare (%holding)
Non Institution
None
Held by 0 Schemes
Held by 0 FIIs
Dillip Kumar Das (17.32%)
K Shiva Kumar (1.82%)
47.57%
Quarterly Results Snapshot (Standalone) - Dec'25 - QoQ

QoQ Growth in quarter ended Dec 2025 is 105.91% vs 18.07% in Sep 2025
QoQ Growth in quarter ended Dec 2025 is 272.41% vs -45.00% in Sep 2025
Half Yearly Results Snapshot (Standalone) - Sep'25

Growth in half year ended Sep 2025 is -57.91% vs -3.89% in Sep 2024
Growth in half year ended Sep 2025 is -234.25% vs -89.99% in Sep 2024
Nine Monthly Results Snapshot (Standalone) - Dec'25
YoY Growth in nine months ended Dec 2025 is -40.47% vs -4.77% in Dec 2024
YoY Growth in nine months ended Dec 2025 is -98.23% vs -84.95% in Dec 2024
Annual Results Snapshot (Standalone) - Mar'25
YoY Growth in year ended Mar 2025 is -1.49% vs 75.46% in Mar 2024
YoY Growth in year ended Mar 2025 is -86.76% vs 655.45% in Mar 2024
About Alfa Transformers Ltd

Company Coordinates


