
Compare Algoquant Fin with Similar Stocks
Dashboard
With ROE of 24.8, it has a Very Expensive valuation with a 12.4 Price to Book Value
- The stock is trading at a discount compared to its peers' average historical valuations
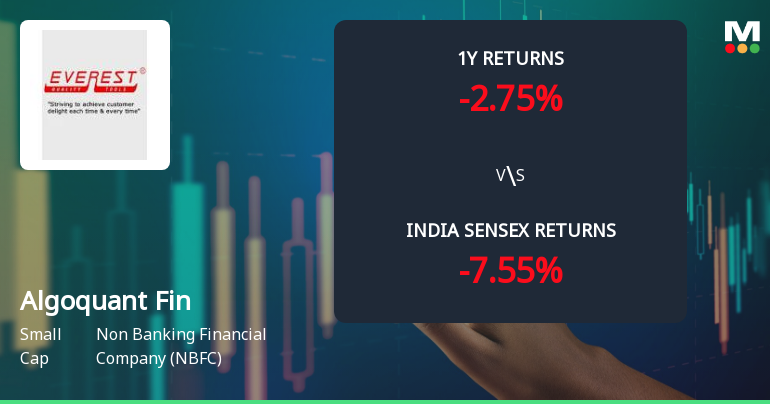
- Over the past year, while the stock has generated a return of 5.69%, its profits have risen by 15.1% ; the PEG ratio of the company is 3.5
32.42% of Promoter Shares are Pledged
Stock DNA
Non Banking Financial Company (NBFC)
INR 1,667 Cr (Small Cap)
50.00
37
0.00%
-0.91
24.84%
12.57
Total Returns (Price + Dividend) 
Algoquant Fin for the last several years.
Risk Adjusted Returns v/s
Returns Beta

News
Algoquant Fintech Ltd Technical Momentum Shifts Amid Mixed Market Signals
Algoquant Fintech Ltd, a small-cap player in the Non Banking Financial Company (NBFC) sector, has experienced a notable shift in its technical momentum, reflecting a complex interplay of bullish and bearish signals. Despite a 4.15% gain on 15 Jun 2026, the company’s overall technical indicators present a nuanced picture, prompting a recent downgrade in its Mojo Grade from Hold to Sell.
Read full news article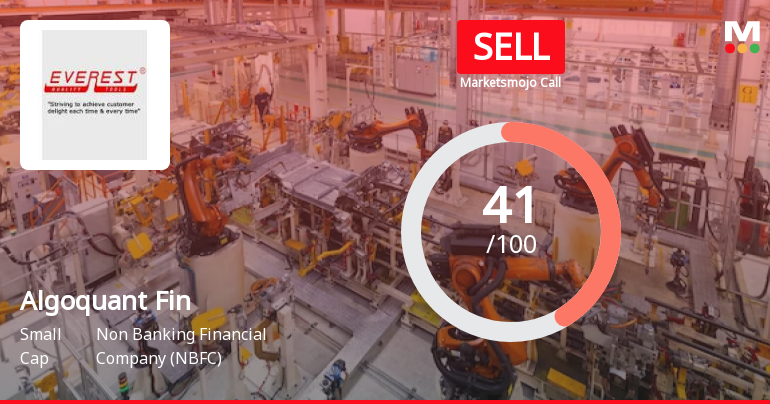
Algoquant Fintech Ltd is Rated Sell
Algoquant Fintech Ltd is rated 'Sell' by MarketsMOJO, with this rating last updated on 25 May 2026. However, the analysis and financial metrics discussed here reflect the stock's current position as of 11 June 2026, providing investors with an up-to-date view of the company’s fundamentals, valuation, financial trends, and technical outlook.
Read full news article
Algoquant Fintech Ltd Technical Momentum Shifts Amid Bearish Signals
Algoquant Fintech Ltd, a small-cap player in the Non Banking Financial Company (NBFC) sector, has experienced a notable shift in its technical momentum, prompting a downgrade in its Mojo Grade from Hold to Sell as of 25 May 2026. The stock’s recent price action and technical indicators suggest a bearish trend, raising concerns for investors amid a broader market context.
Read full news article Announcements
Appointment Of Internal Auditor
29-May-2026 | Source : BSEAppointment of Internal Auditor
Announcement under Regulation 30 (LODR)-Newspaper Publication
29-May-2026 | Source : BSENewspaper publication of the Audited financial results (Standalone and Consolidated) for the quarter and financial year ended March 31 2026
Audited Standalone & Consolidated Financial Result For The Year Ended March 31 2026
28-May-2026 | Source : BSEAudited standalone & consolidated finacial result for the year ended march 31 2026
Corporate Actions

No Upcoming Board Meetings

No Dividend history available

Algoquant Fintech Ltd has announced 1:2 stock split, ex-date: 18 Aug 25

Algoquant Fintech Ltd has announced 8:1 bonus issue, ex-date: 18 Aug 25

No Rights history available
Quality key factors
Valuation key factors
Technicals key factors
 Technical Indicator Scale: Bearish, Mildly Bearish, Sideways, Mildly Bullish, Bullish Turned
 Shareholding Snapshot : Mar 2026
Shareholding Compare (%holding)
Promoters
32.4219
Held by 0 Schemes
Held by 8 FIIs (1.22%)
Algoquant Financials Llp (51.62%)
Algoquant Fintech Ltd Bonus (5.73%)
10.99%
Quarterly Results Snapshot (Consolidated) - Mar'26 - QoQ

QoQ Growth in quarter ended Mar 2026 is 47.48% vs 2.16% in Dec 2025
QoQ Growth in quarter ended Mar 2026 is 186.20% vs -6.68% in Dec 2025
Half Yearly Results Snapshot (Standalone) - Sep'25

Growth in half year ended Sep 2025 is -19.13% vs 500.83% in Sep 2024
Growth in half year ended Sep 2025 is -58.63% vs 2,790.11% in Sep 2024
Nine Monthly Results Snapshot (Standalone) - Dec'25
YoY Growth in nine months ended Dec 2025 is -12.43% vs 177.64% in Dec 2024
YoY Growth in nine months ended Dec 2025 is -38.45% vs 225.53% in Dec 2024
Annual Results Snapshot (Consolidated) - Mar'26
YoY Growth in year ended Mar 2026 is 0.32% vs 50.05% in Mar 2025
YoY Growth in year ended Mar 2026 is 4.74% vs 29.74% in Mar 2025
About Algoquant Fintech Ltd

Company Coordinates


