
Compare Alivus Life with Similar Stocks
Dashboard
High Management Efficiency with a high ROE of 19.43%
The company is Net-Debt Free
Poor long term growth as Net Sales has grown by an annual rate of 6.24% and Operating profit at 5.36% over the last 5 years
Flat results in Mar 26
With ROE of 17.5, it has a Fair valuation with a 4.2 Price to Book Value
Majority shareholders : Promoters
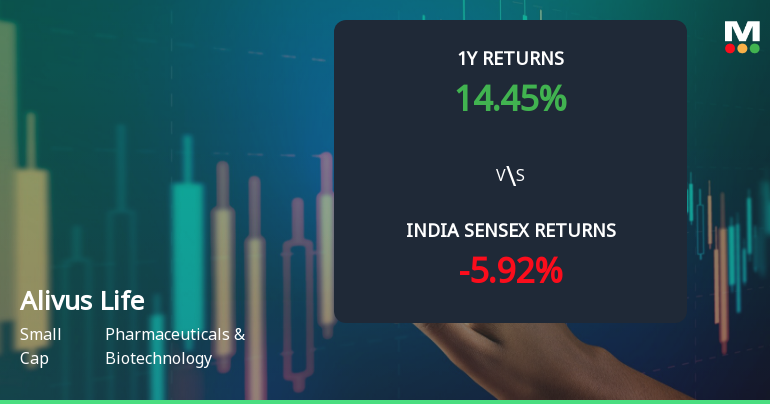
Consistent Returns over the last 3 years
Stock DNA
Pharmaceuticals & Biotechnology
INR 14,029 Cr (Small Cap)
24.00
36
0.43%
-0.22
17.52%
4.30
Total Returns (Price + Dividend) 
Latest dividend: 5 per share ex-dividend date: Sep-01-2025
Risk Adjusted Returns v/s
Returns Beta

News
Alivus Life Sciences Ltd Sees Technical Momentum Shift Amid Mixed Indicator Signals
Alivus Life Sciences Ltd, a small-cap player in the Pharmaceuticals & Biotechnology sector, has experienced a subtle shift in its technical momentum, moving from a bullish to a mildly bullish stance. Despite a slight dip in the daily price, key technical indicators such as MACD and Bollinger Bands maintain a positive outlook, while others like KST and OBV suggest caution. This nuanced technical landscape warrants a detailed analysis for investors seeking clarity on the stock’s near-term trajectory.
Read full news article
Alivus Life Sciences Ltd Technical Momentum Shifts to Bullish Amid Strong Returns
Alivus Life Sciences Ltd has demonstrated a notable shift in price momentum, supported by a series of bullish technical indicators across multiple timeframes. The stock’s recent upgrade from a Buy to a Hold rating reflects a nuanced view of its evolving market dynamics, with technical parameters signalling increased investor confidence amid a competitive pharmaceutical sector backdrop.
Read full news article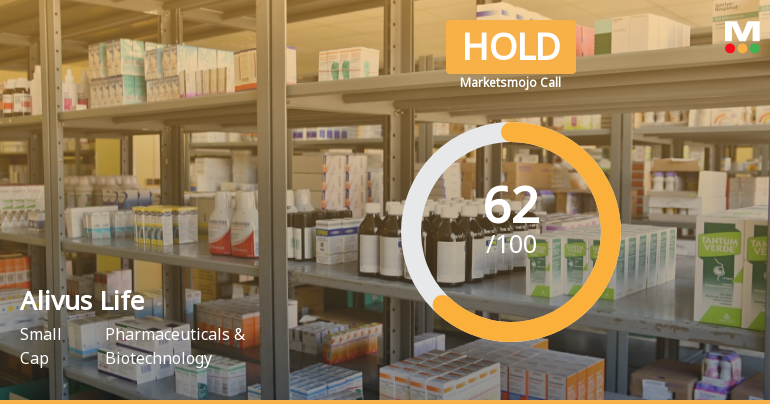
Alivus Life Sciences Ltd is Rated Hold
Alivus Life Sciences Ltd is rated 'Hold' by MarketsMOJO, with this rating last updated on 06 July 2026. However, the analysis and financial metrics discussed here reflect the stock's current position as of 11 July 2026, providing investors with an up-to-date view of the company’s fundamentals, returns, and market performance.
Read full news article Announcements
Announcement under Regulation 30 (LODR)-Analyst / Investor Meet - Intimation
23-Jun-2026 | Source : BSEDisclosure under Regulation 30 of SEBI (Listing Obligation and Disclosure Requirements) Regulations 2015 - Intimation of Institutional Investor Meeting - Plant Visit
Announcement under Regulation 30 (LODR)-Analyst / Investor Meet - Intimation
10-Jun-2026 | Source : BSEDisclosure under Regulation 30 of SEBI (Listing Obligation and Disclosure Requirements) Regulations 2015 - Intimation of Analyst / Institutional Investor Meeting.
Announcement under Regulation 30 (LODR)-Analyst / Investor Meet - Intimation
04-Jun-2026 | Source : BSEDisclosure under Regulation 30 of SEBI (Listing Obligation and Disclosure Requirements) Regulations 2015 - Intimation of Investors/Analyst Meeting
Corporate Actions

No Upcoming Board Meetings

Alivus Life Sciences Ltd has declared 250% dividend, ex-date: 01 Sep 25

No Splits history available

No Bonus history available

No Rights history available
Quality key factors
Valuation key factors
Technicals key factors
 Technical Indicator Scale: Bearish, Mildly Bearish, Sideways, Mildly Bullish, Bullish Turned
 Shareholding Snapshot : Jun 2026
Shareholding Compare (%holding)
Promoters
None
Held by 14 Schemes (5.65%)
Held by 68 FIIs (5.54%)
Nirma Limited (74.87%)
Quant Mutual Fund - Quant Small Cap Fund (2.51%)
10.05%
Quarterly Results Snapshot (Standalone) - Mar'26 - QoQ

QoQ Growth in quarter ended Mar 2026 is 2.41% vs 14.44% in Dec 2025
QoQ Growth in quarter ended Mar 2026 is 8.25% vs 15.56% in Dec 2025
Half Yearly Results Snapshot (Standalone) - Sep'25

Growth in half year ended Sep 2025 is 8.61% vs -6.67% in Sep 2024
Growth in half year ended Sep 2025 is 21.64% vs -18.64% in Sep 2024
Nine Monthly Results Snapshot (Standalone) - Dec'25
YoY Growth in nine months ended Dec 2025 is 7.22% vs -0.53% in Dec 2024
YoY Growth in nine months ended Dec 2025 is 16.89% vs -7.83% in Dec 2024
Annual Results Snapshot (Standalone) - Mar'26
YoY Growth in year ended Mar 2026 is 6.91% vs 4.54% in Mar 2025
YoY Growth in year ended Mar 2026 is 16.24% vs 3.13% in Mar 2025
About Alivus Life Sciences Ltd

Company Coordinates


