
Compare Alkyl Amines with Similar Stocks
Dashboard
High Management Efficiency with a high ROE of 15.81%
Company has a Debt to Equity ratio (avg) of 0.01 times
Poor long term growth as Operating profit has grown by an annual rate -11.84% of over the last 5 years
Flat results in Mar 26
With ROE of 11.7, it has a Very Expensive valuation with a 5.9 Price to Book Value
Majority shareholders : Promoters
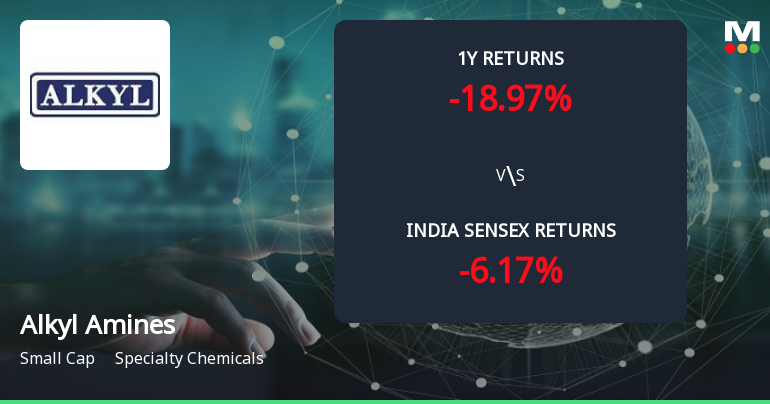
Underperformed the market in the last 1 year
Stock DNA
Specialty Chemicals
INR 9,206 Cr (Small Cap)
50.00
43
0.00%
-0.16
11.74%
6.01
Total Returns (Price + Dividend) 
Latest dividend: 10 per share ex-dividend date: Jun-25-2024
Risk Adjusted Returns v/s
Returns Beta

News
Golden Cross Forms in Alkyl Amines Chemicals Ltd — On a Day the Stock Fell 1.07%. What the Mixed Signals Mean
The 50-day moving average has crossed above the 200-day moving average for Alkyl Amines Chemicals Ltd, signalling a golden cross on 24 Jun 2026. Yet, the stock declined 1.07% on the same day, while monthly momentum indicators remain bearish. This juxtaposition of signals calls for a detailed examination of the technical and fundamental context behind the crossover.
Read full news article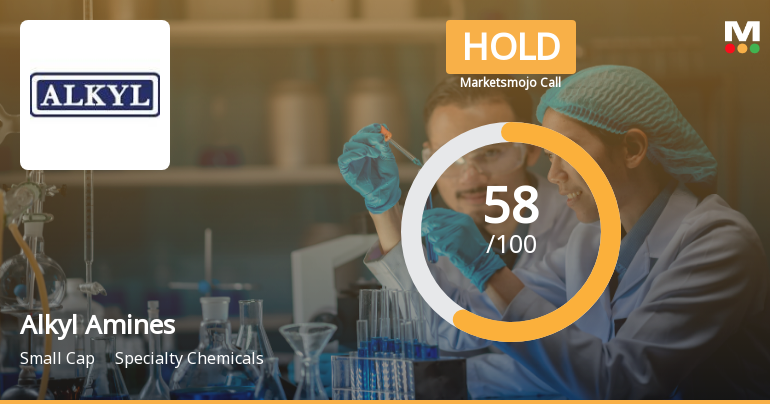
Alkyl Amines Chemicals Ltd Upgraded to Hold on Technical Improvement and Stable Fundamentals
Alkyl Amines Chemicals Ltd, a small-cap player in the specialty chemicals sector, has seen its investment rating upgraded from Sell to Hold as of 23 June 2026. This change reflects a nuanced shift in the company’s technical indicators, valuation metrics, financial trends, and overall quality assessment, signalling cautious optimism among analysts despite some persistent challenges.
Read full news article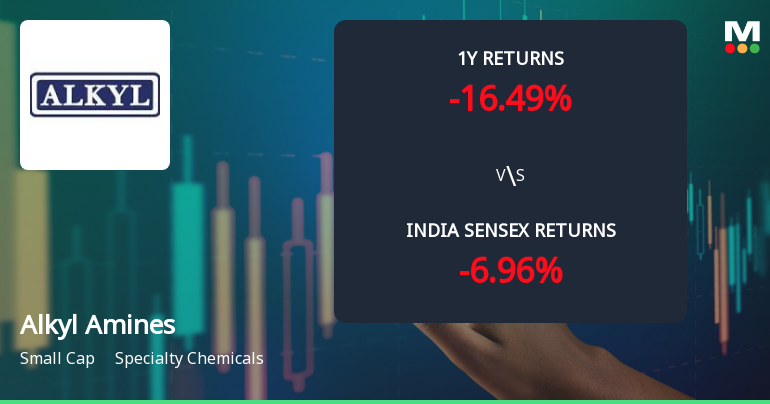
Alkyl Amines Chemicals Ltd Technical Momentum Shifts Amid Mixed Market Signals
Alkyl Amines Chemicals Ltd, a specialty chemicals company, has experienced a notable shift in its technical momentum, moving from a sideways trend to a mildly bullish stance. Despite a slight dip in the stock price on 24 June 2026, key technical indicators such as MACD, Bollinger Bands, and On-Balance Volume (OBV) suggest improving market sentiment, while moving averages and monthly signals present a more cautious outlook. This nuanced technical picture offers investors a balanced perspective on the stock’s near-term potential.
Read full news article Announcements
Announcement under Regulation 30 (LODR)-Allotment of ESOP / ESPS
16-Jun-2026 | Source : BSEAs per attachment
Announcement under Regulation 30 (LODR)-Newspaper Publication
10-Jun-2026 | Source : BSENotice of the 46th Annual General Meeting of the Company to be held on Friday July 3 2026 at 3.00 p.m. (IST) through Video Conferencing (VC)/Other Audio - Visual Means (OAVM)
Reg. 34 (1) Annual Report.
09-Jun-2026 | Source : BSEAnnual Report - FY 2025-26
Corporate Actions

No Upcoming Board Meetings

Alkyl Amines Chemicals Ltd has declared 500% dividend, ex-date: 25 Jun 26

Alkyl Amines Chemicals Ltd has announced 2:5 stock split, ex-date: 11 May 21

No Bonus history available

No Rights history available
Quality key factors
Valuation key factors
Technicals key factors
 Technical Indicator Scale: Bearish, Mildly Bearish, Sideways, Mildly Bullish, Bullish Turned
 Shareholding Snapshot : Mar 2026
Shareholding Compare (%holding)
Promoters
None
Held by 11 Schemes (1.28%)
Held by 91 FIIs (3.45%)
Yogesh Mathradas Kothari (57.64%)
Ikigai Emerging Equity Fund (1.61%)
17.3%
Quarterly Results Snapshot (Standalone) - Mar'26 - QoQ

QoQ Growth in quarter ended Mar 2026 is 9.30% vs -9.09% in Dec 2025
QoQ Growth in quarter ended Mar 2026 is 7.36% vs -1.58% in Dec 2025
Half Yearly Results Snapshot (Standalone) - Sep'25

Growth in half year ended Sep 2025 is -2.41% vs 6.91% in Sep 2024
Growth in half year ended Sep 2025 is -4.10% vs 25.09% in Sep 2024
Nine Monthly Results Snapshot (Standalone) - Dec'25
YoY Growth in nine months ended Dec 2025 is -3.11% vs 9.39% in Dec 2024
YoY Growth in nine months ended Dec 2025 is -3.89% vs 26.85% in Dec 2024
Annual Results Snapshot (Standalone) - Mar'26
YoY Growth in year ended Mar 2026 is -2.29% vs 9.11% in Mar 2025
YoY Growth in year ended Mar 2026 is -3.28% vs 25.02% in Mar 2025
About Alkyl Amines Chemicals Ltd

Company Coordinates


