
Compare All Time Plastic with Similar Stocks
Dashboard
Strong ability to service debt as the company has a low Debt to EBITDA ratio of 0.96 times
Poor long term growth as Net Sales has grown by an annual rate of 12.20% and Operating profit at 21.19% over the last 5 years
Flat results in Mar 26
With ROE of 6.3, it has a Expensive valuation with a 2.4 Price to Book Value
Majority shareholders : Promoters
Stock DNA
Plastic Products - Industrial
INR 1,490 Cr (Small Cap)
38.00
36
0.00%
-0.06
6.33%
2.45
Total Returns (Price + Dividend) 
All Time Plastic for the last several years.
Risk Adjusted Returns v/s
Returns Beta

News
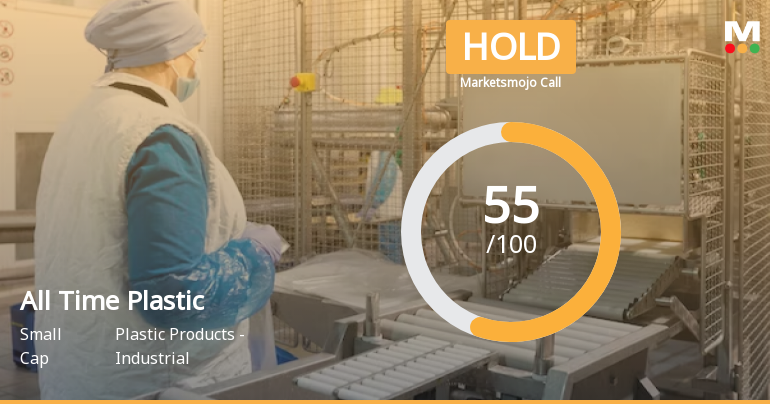
All Time Plastics Ltd is Rated Hold
All Time Plastics Ltd is rated 'Hold' by MarketsMOJO, with this rating last updated on 08 June 2026. However, the analysis and financial metrics discussed here reflect the stock's current position as of 09 June 2026, providing investors with the latest insights into the company’s performance and outlook.
Read full news article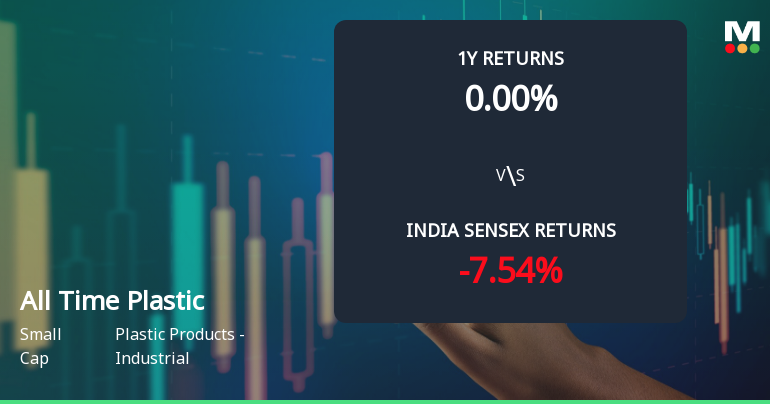
All Time Plastics Ltd Technical Momentum Shifts Amid Market Challenges
All Time Plastics Ltd, a small-cap player in the Plastic Products - Industrial sector, has experienced a subtle shift in its technical momentum, moving from a sideways trend to a mildly bullish stance. Despite a recent downgrade in its Mojo Grade from Hold to Sell, the stock’s technical indicators present a nuanced picture that investors should carefully analyse amid broader market pressures.
Read full news article
All Time Plastics Ltd Faces Technical Momentum Shift Amid Market Headwinds
All Time Plastics Ltd, a small-cap player in the Plastic Products - Industrial sector, has experienced a notable shift in its technical momentum, prompting a downgrade in its MarketsMOJO grade from Hold to Sell as of 1 June 2026. Despite a marginal price increase of 0.05% to ₹220.05, the stock’s technical indicators reveal a transition from mildly bullish trends to sideways or bearish signals, raising concerns about its near-term trajectory.
Read full news article Announcements
Announcement under Regulation 30 (LODR)-Earnings Call Transcript
01-Jun-2026 | Source : BSEEarning Call Transcript for Q4 FY26
Announcement under Regulation 30 (LODR)-Analyst / Investor Meet - Outcome
25-May-2026 | Source : BSEAudio Recordings of Q4 FY 2025-26 Earnings Call
Announcement under Regulation 30 (LODR)-Investor Presentation
24-May-2026 | Source : BSEInvestor Presentation for the quarter and year ended 31st March 2026.
Corporate Actions

No Upcoming Board Meetings

No Dividend history available

No Splits history available

No Bonus history available

No Rights history available
Quality key factors
Valuation key factors
Technicals key factors
 Technical Indicator Scale: Bearish, Mildly Bearish, Sideways, Mildly Bullish, Bullish Turned
 Shareholding Snapshot : Mar 2026
Shareholding Compare (%holding)
Promoters
None
Held by 3 Schemes (2.27%)
Held by 6 FIIs (2.93%)
Bhupesh Punamchand Shah (23.33%)
Abakkus Four2eight Opportunities Fund (6.16%)
12.45%
Quarterly Results Snapshot (Standalone) - Mar'26 - QoQ

QoQ Growth in quarter ended Mar 2026 is -8.50% vs 8.07% in Dec 2025
QoQ Growth in quarter ended Mar 2026 is 2.62% vs 117.06% in Dec 2025
Half Yearly Results Snapshot (Standalone) - Sep'25
Not Applicable: The company has declared_date for only one period
Not Applicable: The company has declared_date for only one period
Nine Monthly Results Snapshot (Standalone) - Dec'25
Not Applicable: The company has declared_date for only one period
Not Applicable: The company has declared_date for only one period
Annual Results Snapshot (Standalone) - Mar'26

YoY Growth in year ended Mar 2026 is 9.36% vs 8.84% in Mar 2025
YoY Growth in year ended Mar 2026 is -24.74% vs 5.60% in Mar 2025
About All Time Plastics Ltd

Company Coordinates


