
Compare All Time Plastic with Similar Stocks
Stock DNA
Plastic Products - Industrial
INR 1,627 Cr (Small Cap)
41.00
35
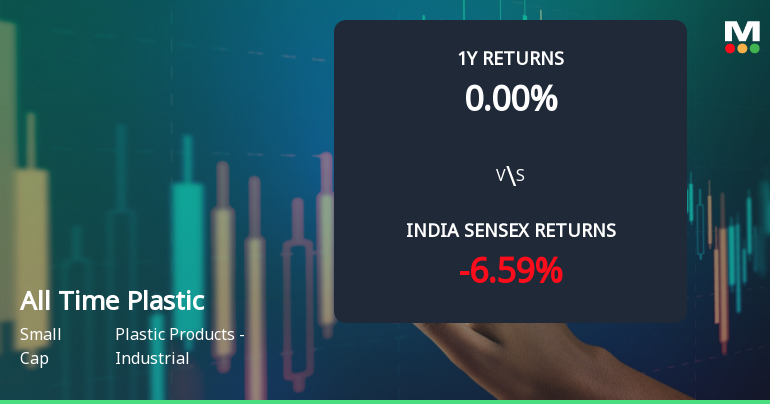
0.00%
-0.06
6.33%
2.63
Total Returns (Price + Dividend) 
All Time Plastic for the last several years.
Risk Adjusted Returns v/s
Returns Beta

News
All Time Plastics Ltd Technical Momentum Shifts Amid Mixed Market Signals
All Time Plastics Ltd has experienced a notable shift in its technical momentum, moving from a mildly bearish stance to a sideways trend, reflecting a complex interplay of bullish and bearish signals across key indicators. Despite a recent upgrade in price momentum, the company’s overall MarketsMOJO grade has been downgraded to Sell, underscoring the nuanced outlook for this small-cap player in the Plastic Products - Industrial sector.
Read full news article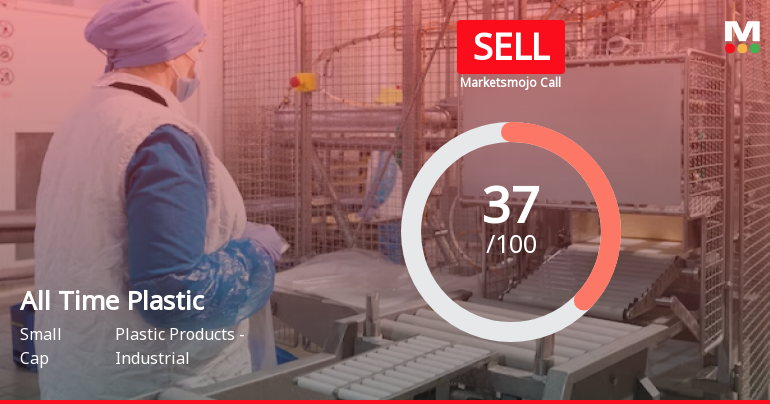
All Time Plastics Ltd is Rated Sell
All Time Plastics Ltd is rated Sell by MarketsMOJO, with this rating last updated on 29 June 2026. While the rating change occurred on that date, the analysis and financial metrics discussed here reflect the stock’s current position as of 12 July 2026, providing investors with the most up-to-date perspective on the company’s performance and outlook.
Read full news article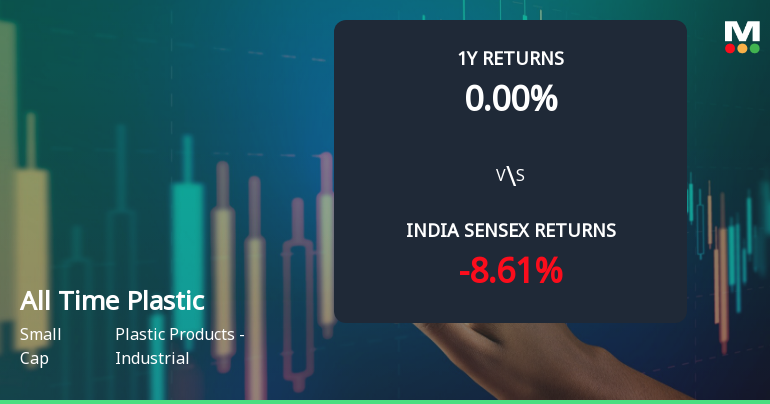
All Time Plastics Ltd Faces Technical Momentum Shift Amid Bearish Signals
All Time Plastics Ltd, a small-cap player in the Plastic Products - Industrial sector, has experienced a notable shift in its technical momentum, moving from a sideways trend to a mildly bearish stance. Despite some bullish signals on weekly charts, the overall technical indicators suggest caution for investors as the stock price declined by 4.26% on 9 July 2026, closing at ₹237.35.
Read full news article Announcements
Compliances-Certificate under Reg. 74 (5) of SEBI (DP) Regulations 2018
02-Jul-2026 | Source : BSECertificate under Regulation 74(5) of SEBI (DP) Regulations 2018 for quarter ended June 2026
Closure of Trading Window
24-Jun-2026 | Source : BSEClosure of Trading Window for quarter ended June 2026
Announcement under Regulation 30 (LODR)-Analyst / Investor Meet - Intimation
22-Jun-2026 | Source : BSEIntimation of Schedule of Analyst / Institutional Investor meeting under the SEBI (LODR) Regulations 2015
Corporate Actions

No Upcoming Board Meetings

No Dividend history available

No Splits history available

No Bonus history available

No Rights history available
Quality key factors
Valuation key factors
Technicals key factors
 Technical Indicator Scale: Bearish, Mildly Bearish, Sideways, Mildly Bullish, Bullish Turned
 Shareholding Snapshot : Jun 2026
Shareholding Compare (%holding)
Promoters
None
Held by 3 Schemes (2.51%)
Held by 9 FIIs (2.98%)
Bhupesh Punamchand Shah (23.33%)
Abakkus Four2eight Opportunities Fund (6.16%)
12.1%
Quarterly Results Snapshot (Standalone) - Mar'26 - QoQ

QoQ Growth in quarter ended Mar 2026 is -8.50% vs 8.07% in Dec 2025
QoQ Growth in quarter ended Mar 2026 is 2.62% vs 117.06% in Dec 2025
Half Yearly Results Snapshot (Standalone) - Sep'25
Not Applicable: The company has declared_date for only one period
Not Applicable: The company has declared_date for only one period
Nine Monthly Results Snapshot (Standalone) - Dec'25
Not Applicable: The company has declared_date for only one period
Not Applicable: The company has declared_date for only one period
Annual Results Snapshot (Standalone) - Mar'26

YoY Growth in year ended Mar 2026 is 9.36% vs 8.84% in Mar 2025
YoY Growth in year ended Mar 2026 is -24.74% vs 5.60% in Mar 2025
About All Time Plastics Ltd

Company Coordinates


