
Compare Allcargo Termi with Similar Stocks
Dashboard
Weak Long Term Fundamental Strength with an average Return on Capital Employed (ROCE) of 9.80%
- Poor long term growth as Net Sales has grown by an annual rate of 5.16% and Operating profit at 0.48% over the last 5 years
- Low ability to service debt as the company has a high Debt to EBITDA ratio of 4.76 times
Flat results in Mar 26
Despite the size of the company, domestic mutual funds hold only 0% of the company
Below par performance in long term as well as near term
Stock DNA
Transport Infrastructure
INR 587 Cr (Micro Cap)
13.00
39
0.00%
2.03
12.80%
1.63
Total Returns (Price + Dividend) 
Latest dividend: 0.4956011730205278 per share ex-dividend date: Sep-08-2023
Risk Adjusted Returns v/s
Returns Beta

News
Allcargo Terminals Ltd is Rated Strong Sell
Allcargo Terminals Ltd is rated Strong Sell by MarketsMOJO, with this rating last updated on 08 July 2026. However, the analysis and financial metrics discussed here reflect the stock's current position as of 31 July 2026, providing investors with the latest insights into the company’s performance and outlook.
Read full news article
Allcargo Terminals Ltd is Rated Strong Sell
Allcargo Terminals Ltd is rated Strong Sell by MarketsMOJO. This rating was last updated on 08 July 2026, reflecting a reassessment of the stock’s outlook. However, all fundamentals, returns, and financial metrics discussed here are current as of 20 July 2026, providing investors with the latest view of the company’s position in the market.
Read full news article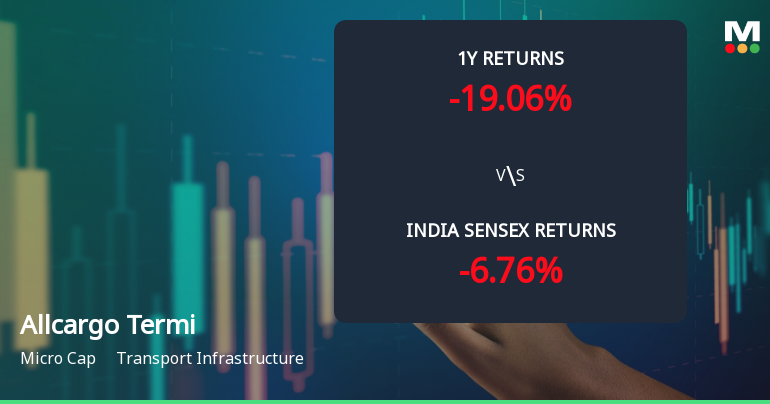
Allcargo Terminals Ltd Faces Intensified Downtrend Amid Bearish Technical Signals
Allcargo Terminals Ltd has experienced a notable shift in price momentum, with technical indicators signalling a bearish outlook. The stock’s recent downgrade to a Strong Sell by MarketsMOJO reflects deteriorating trend assessments and weakening market sentiment within the transport infrastructure sector.
Read full news article Announcements
Announcement under Regulation 30 (LODR)-Monthly Business Updates
17-Jul-2026 | Source : BSEMonthly Business Updates for the month of June 2026
Announcement under Regulation 30 (LODR)-Updates on Acquisition
09-Jul-2026 | Source : BSEDisclosure pertaining to acquisition of 2 shares (25% stake) in Allcargo Group Services Private Limited
Compliances-Certificate under Reg. 74 (5) of SEBI (DP) Regulations 2018
09-Jul-2026 | Source : BSECertificate under Reg 74(5) of SEBI (DP) Regulation 2018 for the quarter ended June 2026 for fully and partly paid shares.
Corporate Actions

No Upcoming Board Meetings

Allcargo Terminals Ltd has declared 25% dividend, ex-date: 08 Sep 23

No Splits history available

No Bonus history available

Allcargo Terminals Ltd has announced 3:19 rights issue, ex-date: 14 Nov 25
Quality key factors
Valuation key factors
Technicals key factors
 Technical Indicator Scale: Bearish, Mildly Bearish, Sideways, Mildly Bullish, Bullish Turned
 Shareholding Snapshot : Jun 2026
Shareholding Compare (%holding)
Promoters
None
Held by 0 Schemes
Held by 16 FIIs (5.34%)
Shashi Kiran Shetty (59.41%)
Ashish Chandna (2.88%)
20.73%
Quarterly Results Snapshot (Consolidated) - Mar'26 - QoQ

QoQ Growth in quarter ended Mar 2026 is -4.72% vs 5.40% in Dec 2025
QoQ Growth in quarter ended Mar 2026 is -41.65% vs 33.01% in Dec 2025
Half Yearly Results Snapshot (Consolidated) - Sep'25
Growth in half year ended Sep 2025 is 2.57% vs 5.05% in Sep 2024

Growth in half year ended Sep 2025 is -0.49% vs -2.05% in Sep 2024
Nine Monthly Results Snapshot (Consolidated) - Dec'25
YoY Growth in nine months ended Dec 2025 is 7.15% vs 3.75% in Dec 2024
YoY Growth in nine months ended Dec 2025 is 9.76% vs -9.27% in Dec 2024
Annual Results Snapshot (Consolidated) - Mar'26
YoY Growth in year ended Mar 2026 is 8.31% vs 3.39% in Mar 2025
YoY Growth in year ended Mar 2026 is 45.00% vs -31.33% in Mar 2025
About Allcargo Terminals Ltd

Company Coordinates


