
Compare Allied Blenders with Similar Stocks
Dashboard
High Management Efficiency with a high ROCE of 16.71%
Healthy long term growth as Operating profit has grown by an annual rate 58.45%
With ROCE of 17.5, it has a Attractive valuation with a 7.3 Enterprise value to Capital Employed
Majority shareholders : Promoters
Market Beating Performance
Stock DNA
Beverages
INR 19,576 Cr (Small Cap)
80.00
57
0.82%
0.59
13.86%
11.06
Total Returns (Price + Dividend) 
Latest dividend: 5.363259493670887 per share ex-dividend date: Jun-25-2026
Risk Adjusted Returns v/s
Returns Beta

News
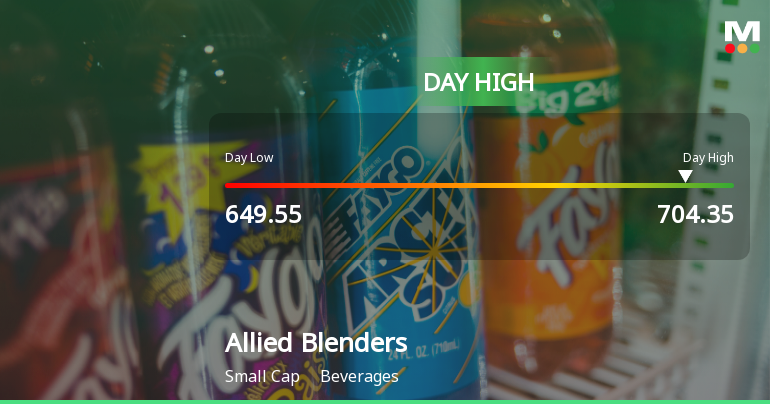
Allied Blenders & Distillers Ltd Surges 7.31% to Day's High of Rs 699 — Outperforms Sector by 6.61 Percentage Points
The Sensex advanced 0.64% on 06 Jul 2026, yet Allied Blenders & Distillers Ltd outpaced the market with a robust 7.31% gain, touching an intraday high of Rs 699. This 6.61 percentage-point outperformance over the Beverages sector signals a distinctly stock-specific rally rather than a broad market lift.
Read full news article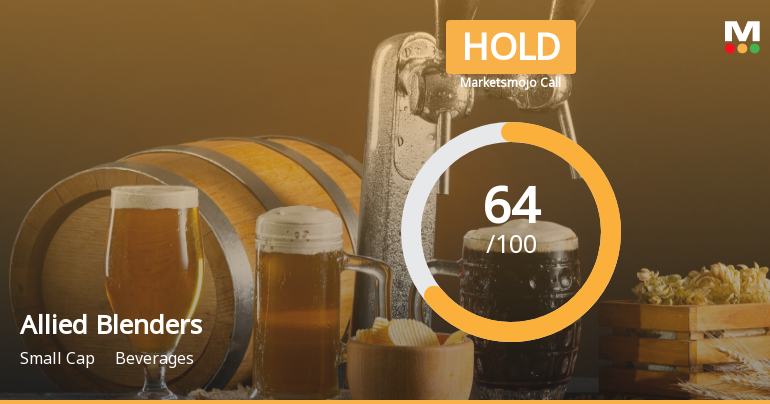
Allied Blenders & Distillers Ltd is Rated Hold by MarketsMOJO
Allied Blenders & Distillers Ltd is rated 'Hold' by MarketsMOJO, with this rating last updated on 08 June 2026. While the rating change occurred on that date, the analysis and financial metrics discussed here reflect the stock’s current position as of 02 July 2026, providing investors with the latest insights into the company’s performance and outlook.
Read full news article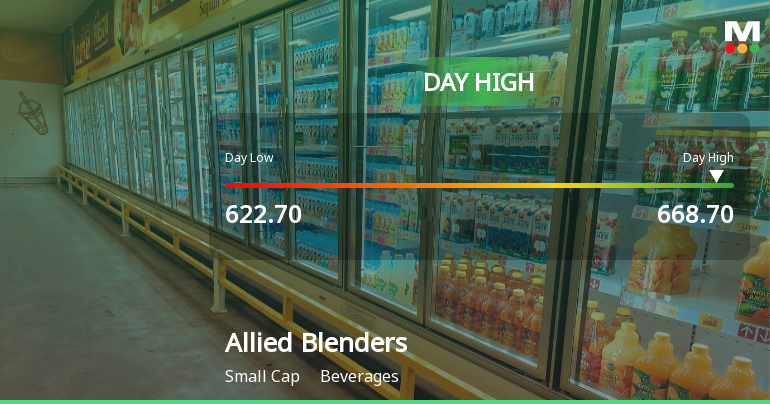
Allied Blenders & Distillers Ltd Surges 7.12% to Day's High of Rs 667.65 — Outperforms Sector by 8.22 Percentage Points
While the Sensex declined 0.54% on 29 Jun 2026, Allied Blenders & Distillers Ltd surged 7.12%, touching an intraday high of Rs 667.65. This 8.22-percentage-point outperformance over its Beverages sector peers signals a distinctly stock-specific rally rather than a market-wide lift.
Read full news article Announcements
Closure of Trading Window
29-Jun-2026 | Source : BSEClosure of Trading Window
Announcement under Regulation 30 (LODR)-Change in Management
18-Jun-2026 | Source : BSEChange in Key Managerial Personnel - Chief Revenue Officer (CRO)
Board Meeting Outcome for Change In Key Managerial Personnel (KMP) - Chief Revenue Officer (CRO)
18-Jun-2026 | Source : BSEChange in Key Managerial Personnel (KMP) - Chief Revenue Officer (CRO)
Corporate Actions

No Upcoming Board Meetings

Allied Blenders & Distillers Ltd has declared 270% dividend, ex-date: 25 Jun 26

No Splits history available

No Bonus history available

No Rights history available
Quality key factors
Valuation key factors
Technicals key factors
 Technical Indicator Scale: Bearish, Mildly Bearish, Sideways, Mildly Bullish, Bullish Turned
 Shareholding Snapshot : Mar 2026
Shareholding Compare (%holding)
Promoters
None
Held by 18 Schemes (3.71%)
Held by 55 FIIs (3.23%)
Bina Kishore Chhabria (58.2%)
Nippon Life India Trustee Ltd-a/c Nippon India Small Cap Fund (2.1%)
8.6%
Quarterly Results Snapshot (Consolidated) - Mar'26 - QoQ

QoQ Growth in quarter ended Mar 2026 is 0.39% vs 1.30% in Dec 2025
QoQ Growth in quarter ended Mar 2026 is -38.37% vs 3.37% in Dec 2025
Half Yearly Results Snapshot (Consolidated) - Sep'25

Growth in half year ended Sep 2025 is 17.70% vs -2.41% in Sep 2024
Growth in half year ended Sep 2025 is 105.70% vs 578.52% in Sep 2024
Nine Monthly Results Snapshot (Consolidated) - Dec'25
YoY Growth in nine months ended Dec 2025 is 12.18% vs 1.52% in Dec 2024
YoY Growth in nine months ended Dec 2025 is 61.19% vs 2,641.27% in Dec 2024
Annual Results Snapshot (Consolidated) - Mar'26
YoY Growth in year ended Mar 2026 is 11.45% vs 5.77% in Mar 2025
YoY Growth in year ended Mar 2026 is 17.17% vs 10,548.09% in Mar 2025
About Allied Blenders & Distillers Ltd

Company Coordinates


