
Compare Alufluoride with Similar Stocks
Dashboard
High Management Efficiency with a high ROCE of 23.15%
Strong ability to service debt as the company has a low Debt to EBITDA ratio of 1.01 times
Healthy long term growth as Operating profit has grown by an annual rate 49.97%
Positive results in Mar 26
With ROE of 20, it has a Attractive valuation with a 2.9 Price to Book Value
Stock DNA
Commodity Chemicals
INR 371 Cr (Micro Cap)
14.00
43
0.65%
0.00
20.00%
2.89
Total Returns (Price + Dividend) 
Latest dividend: 3 per share ex-dividend date: Jun-27-2025
Risk Adjusted Returns v/s
Returns Beta

News
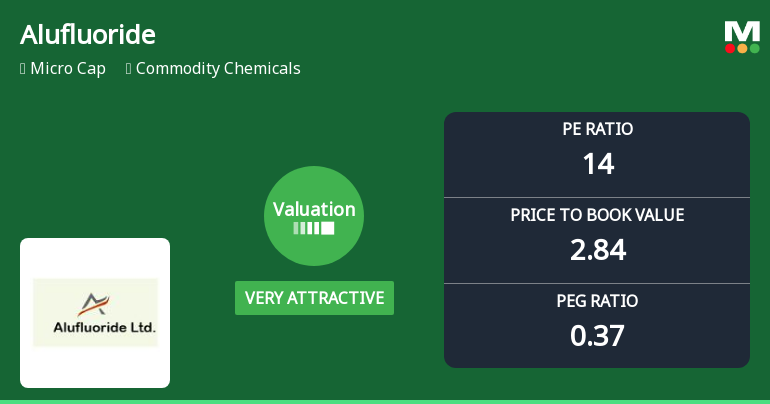
Alufluoride Ltd Valuation Shifts to Very Attractive Amid Strong Financial Metrics
Alufluoride Ltd, a micro-cap player in the commodity chemicals sector, has seen a notable improvement in its valuation metrics, shifting from an attractive to a very attractive rating. This upgrade reflects a significant change in price-to-earnings (P/E) and price-to-book value (P/BV) ratios relative to its historical averages and peer group, signalling enhanced price attractiveness for investors.
Read full news article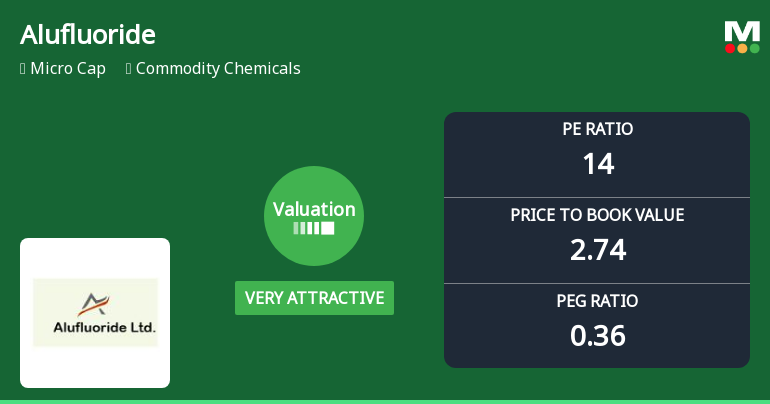
Alufluoride Ltd’s Valuation Turns Very Attractive Amid Strong Financial Metrics
Alufluoride Ltd, a micro-cap player in the commodity chemicals sector, has seen a significant improvement in its valuation metrics, shifting from an attractive to a very attractive rating. This upgrade reflects a compelling price attractiveness supported by robust financial performance and favourable peer comparisons, positioning the stock as a strong buy in the current market environment.
Read full news article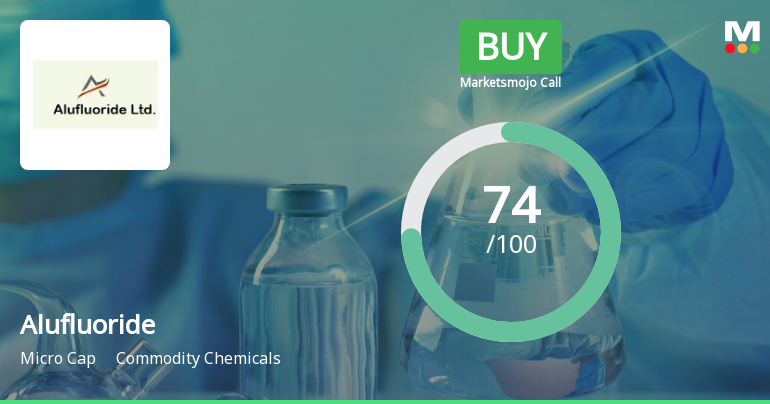
Alufluoride Ltd is Rated Buy
Alufluoride Ltd is rated 'Buy' by MarketsMOJO, with this rating last updated on 08 April 2026. However, the analysis and financial metrics discussed here reflect the stock's current position as of 14 June 2026, providing investors with an up-to-date view of the company’s fundamentals, valuation, financial trends, and technical outlook.
Read full news article Announcements
Compliances-Reg.24(A)-Annual Secretarial Compliance
30-May-2026 | Source : BSEAs attached
Announcement under Regulation 30 (LODR)-Strikes /Lockouts / Disturbances
23-May-2026 | Source : BSEDetails as attached.
Record Date And Annual General Meeting Of The Company
23-May-2026 | Source : BSEAs attached
Corporate Actions

No Upcoming Board Meetings

Alufluoride Ltd has declared 40% dividend, ex-date: 03 Jul 26

No Splits history available

No Bonus history available

No Rights history available
Quality key factors
Valuation key factors
Technicals key factors
 Technical Indicator Scale: Bearish, Mildly Bearish, Sideways, Mildly Bullish, Bullish Turned
 Shareholding Snapshot : Mar 2026
Shareholding Compare (%holding)
Promoters
None
Held by 0 Schemes
Held by 1 FIIs (0.05%)
Sunitha Vemulapalli (22.15%)
Lincoln P Coelho (2.05%)
34.04%
Quarterly Results Snapshot (Consolidated) - Mar'26 - YoY

YoY Growth in quarter ended Mar 2026 is -4.46% vs 18.16% in Mar 2025

YoY Growth in quarter ended Mar 2026 is 211.33% vs -71.86% in Mar 2025
Half Yearly Results Snapshot (Consolidated) - Sep'25
Growth in half year ended Sep 2025 is 13.43% vs 6.82% in Sep 2024
Growth in half year ended Sep 2025 is 5.65% vs 16.76% in Sep 2024
Nine Monthly Results Snapshot (Consolidated) - Dec'25
YoY Growth in nine months ended Dec 2025 is 16.85% vs 13.03% in Dec 2024
YoY Growth in nine months ended Dec 2025 is 24.06% vs 33.82% in Dec 2024
Annual Results Snapshot (Consolidated) - Mar'26
YoY Growth in year ended Mar 2026 is 10.74% vs 14.46% in Mar 2025
YoY Growth in year ended Mar 2026 is 38.92% vs 2.43% in Mar 2025
About Alufluoride Ltd

Company Coordinates


