
Compare Amanta Healthcar with Similar Stocks
Dashboard
Weak Long Term Fundamental Strength with a 9.30% CAGR growth in Operating Profits over the last 5 years
- Company's ability to service its debt is weak with a poor EBIT to Interest (avg) ratio of 1.30
- The company has been able to generate a Return on Equity (avg) of 8.18% signifying low profitability per unit of shareholders funds
Flat results in Mar 26
With ROCE of 11.1, it has a Attractive valuation with a 2.2 Enterprise value to Capital Employed
Increasing Participation by Institutional Investors
Stock DNA
Pharmaceuticals & Biotechnology
INR 645 Cr (Micro Cap)
40.00
36
0.00%
0.69
7.60%
2.93
Total Returns (Price + Dividend) 
Amanta Healthcar for the last several years.
Risk Adjusted Returns v/s
Returns Beta

News
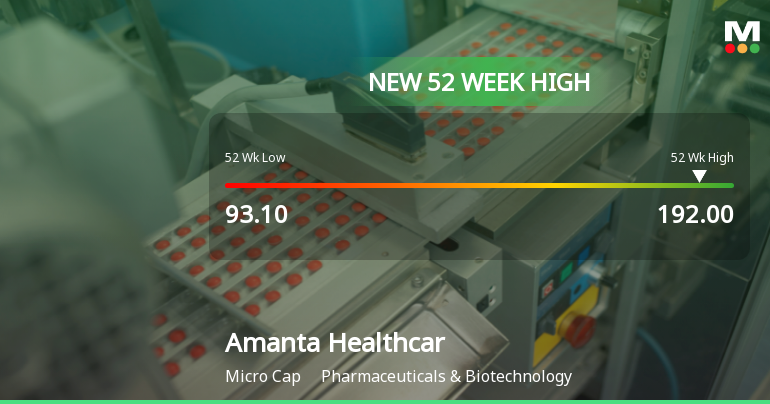
Broad-Based Technical Strength Lifts Amanta Healthcare Ltd to 52-Week High of Rs 192
With a decisive surge to Rs 192 on 09 Jul 2026, Amanta Healthcare Ltd has reached a fresh 52-week and all-time high, propelled by a strong alignment of technical indicators and sustained price momentum over the past week.
Read full news article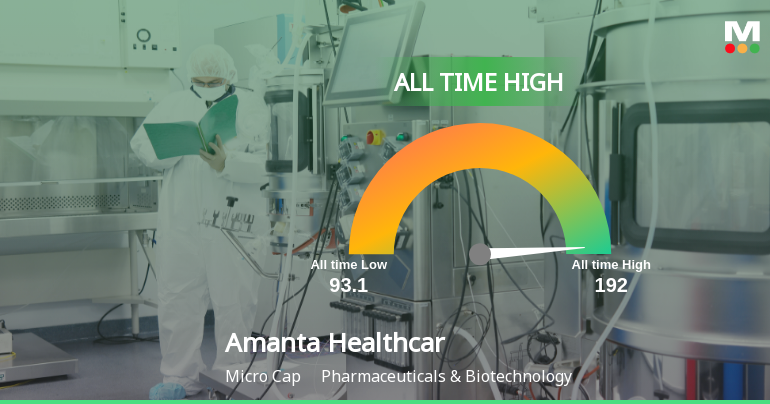
Amanta Healthcare Ltd Hits All-Time High of Rs 192 as Momentum Builds Across Timeframes
Extending its winning streak to six sessions, Amanta Healthcare Ltd touched a fresh all-time high of Rs 192 on 09 Jul 2026, marking a 17.3% gain over this period and significantly outpacing the Sensex's modest gains.
Read full news article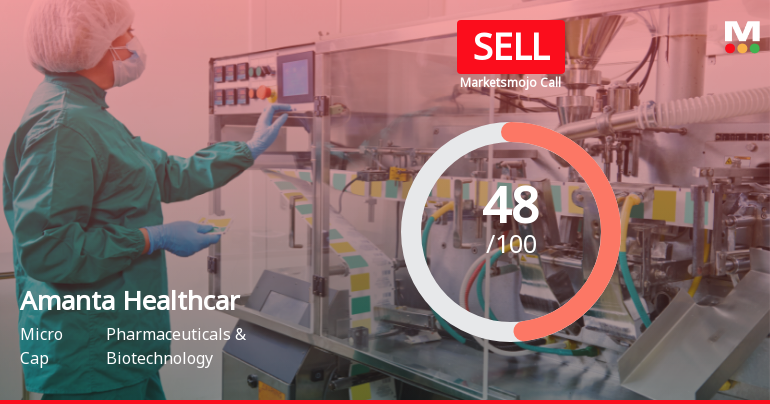
Amanta Healthcare Downgraded to Sell Amid Mixed Technicals and Valuation Concerns
Amanta Healthcare Ltd, a micro-cap player in the Pharmaceuticals & Biotechnology sector, has seen its investment rating downgraded from Hold to Sell as of 8 July 2026. This shift reflects a reassessment across key parameters including technical trends, valuation metrics, financial performance, and overall quality scores, signalling caution for investors despite recent strong price gains.
Read full news article Announcements
Compliances-Certificate under Reg. 74 (5) of SEBI (DP) Regulations 2018
10-Jul-2026 | Source : BSECertificate under Reg. 74(5) of SEBI (DP) Regulations 2018
Announcement under Regulation 30 (LODR)-Analyst / Investor Meet - Outcome
09-Jul-2026 | Source : BSEAnnouncement under Regulation 30 (LODR)-Analyst / Investor Meet - Outcome
Announcement under Regulation 30 (LODR)-Analyst / Investor Meet - Intimation
06-Jul-2026 | Source : BSEIntimation of Schedule of Investor Meet
Corporate Actions

No Upcoming Board Meetings

No Dividend history available

No Splits history available

No Bonus history available

No Rights history available
Quality key factors
Valuation key factors
Technicals key factors
 Technical Indicator Scale: Bearish, Mildly Bearish, Sideways, Mildly Bullish, Bullish Turned
 Shareholding Snapshot : Mar 2026
Shareholding Compare (%holding)
Promoters
None
Held by 1 Schemes (5.09%)
Held by 4 FIIs (0.85%)
Bhavesh Girishbhai Patel (16.25%)
Bandhan Small Cap Fund (5.09%)
16.0%
Quarterly Results Snapshot (Standalone) - Mar'26 - QoQ

QoQ Growth in quarter ended Mar 2026 is 3.36% vs 5.08% in Dec 2025
QoQ Growth in quarter ended Mar 2026 is 19.44% vs 282.64% in Dec 2025
Half Yearly Results Snapshot (Standalone) - Sep'25
Not Applicable: The company has declared_date for only one period
Not Applicable: The company has declared_date for only one period
Nine Monthly Results Snapshot (Standalone) - Dec'25
Not Applicable: The company has declared_date for only one period
Not Applicable: The company has declared_date for only one period
Annual Results Snapshot (Standalone) - Mar'26

YoY Growth in year ended Mar 2026 is 4.72% vs -2.01% in Mar 2025
YoY Growth in year ended Mar 2026 is 41.71% vs 189.26% in Mar 2025
About Amanta Healthcare Ltd

Company Coordinates


