
 Price Point
Compare Amco India with Similar Stocks
ScoreDashboard
Weak Long Term Fundamental Strength with a -9.99% CAGR growth in Operating Profits over the last 5 years
- Company's ability to service its debt is weak with a poor EBIT to Interest (avg) ratio of 1.40
- The company has been able to generate a Return on Equity (avg) of 4.34% signifying low profitability per unit of shareholders funds
Underperformed the market in the last 1 year
Mojo ParametersStock DNA

Industrial Products

INR 26 Cr (Micro Cap)

19.00
11

0.00%

0.27

3.70%

0.72
Total ReturnsTotal Returns (Price + Dividend) 
Latest dividend: 1.0000 per share ex-dividend date: Sep-18-2006
Risk Adjusted Returns v/s
Returns Beta
 News & Corporate Actions
News
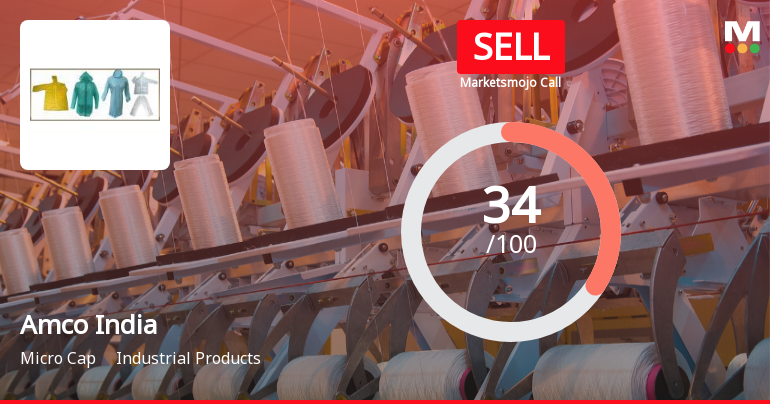
Amco India Ltd Upgraded to Sell: A Detailed Analysis of Quality, Valuation, Financial Trend and Technicals
Amco India Ltd, a micro-cap player in the Industrial Products sector, has seen its investment rating upgraded from Strong Sell to Sell as of 23 September 2026. This change reflects a nuanced shift in the company’s valuation and technical outlook, even as its fundamental quality and financial trends remain under pressure. The upgrade is driven primarily by improved technical indicators and a more attractive valuation profile relative to peers, though challenges persist in profitability and long-term growth metrics.
Read full news article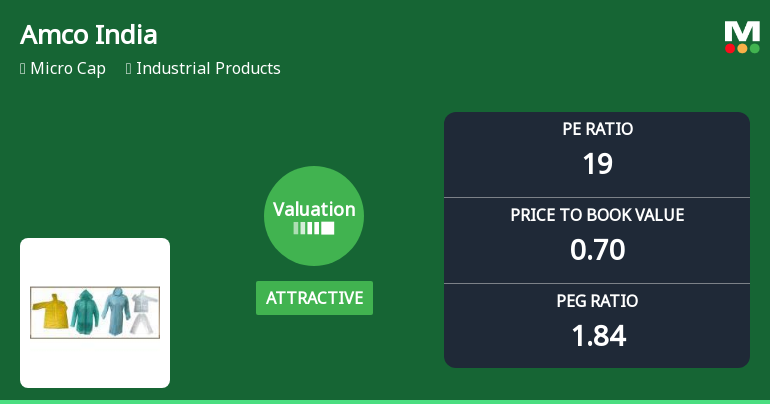
Amco India Ltd Valuation Shifts Signal Renewed Price Attractiveness Amid Mixed Returns
Amco India Ltd, a micro-cap player in the Industrial Products sector, has seen its valuation parameters shift notably, with its price-to-earnings (P/E) and price-to-book value (P/BV) ratios moving into more attractive territory. Despite this, the company’s overall financial health and market performance present a complex picture, prompting a reassessment of its investment appeal.
Read full news article
Amco India Ltd Downgraded to Strong Sell Amid Deteriorating Technicals and Valuation Concerns
Amco India Ltd, a micro-cap player in the Industrial Products sector, has seen its investment rating downgraded from Sell to Strong Sell as of 7 September 2026. This shift reflects deteriorating technical indicators, a reclassification of valuation from attractive to fair, and ongoing concerns about the company’s financial trends and quality metrics. Despite some positive quarterly results, the overall outlook remains weak, prompting a cautious stance among investors.
Read full news article Announcements
Announcement under Regulation 30 (LODR)-Newspaper Publication
07-Sep-2026 | Source : BSEIntimation of newspaper advertisement of Notice E-voting instructions & Book Closure dates for the 39th Annual General Meeting of the Company.
Notice Of 39Th Annual General Meeting (AGM) Of The Company.
05-Sep-2026 | Source : BSEAttached herewith the Notice of 39th Annual General Meeting of the Company scheduled to be held on Wednesday 30th September 2026 at 01.00 P.M through VC/OAVM.
Reg. 34 (1) Annual Report.
05-Sep-2026 | Source : BSEAttached herewith the Annual Report of the Company for the financial year 2025-26.
Corporate Actions

No Upcoming Board Meetings

Amco India Ltd has declared 10% dividend, ex-date: 18 Sep 06

No Splits history available

No Bonus history available

No Rights history available
Key FactorsQuality key factors
Valuation key factors
Technicals key factors
 Technical Indicator Scale: Bearish, Mildly Bearish, Sideways, Mildly Bullish, Bullish Turned Shareholding
Shareholding Snapshot : Jun 2026
Shareholding Compare (%holding)
Promoters
None
Held by 1 Schemes (0.0%)
Held by 0 FIIs
Surender Kumar Gupta (17.94%)
Raju Ajit Bhandari (5.38%)
30.05%
FinancialQuarterly Results Snapshot (Standalone) - Jun'26 - QoQ
 Compare with Peers
QoQ Growth in quarter ended Jun 2026 is 10.55% vs 2.03% in Mar 2026
QoQ Growth in quarter ended Jun 2026 is 1,780.00% vs -66.67% in Mar 2026

Half Yearly Results Snapshot (Standalone) - Sep'25
Growth in half year ended Sep 2025 is 15.04% vs -5.24% in Sep 2024

Growth in half year ended Sep 2025 is -85.06% vs 50.00% in Sep 2024
Nine Monthly Results Snapshot (Standalone) - Dec'25
YoY Growth in nine months ended Dec 2025 is 9.72% vs -3.37% in Dec 2024
YoY Growth in nine months ended Dec 2025 is -81.70% vs 163.79% in Dec 2024
Annual Results Snapshot (Standalone) - Mar'26
YoY Growth in year ended Mar 2026 is 11.81% vs 1.65% in Mar 2025
YoY Growth in year ended Mar 2026 is -82.35% vs 125.30% in Mar 2025
 Company CV
About Amco India Ltd










