
Compare American Strategic Investment Co. with Similar Stocks
Total Returns (Price + Dividend) 
TimePeriod
Price Return
Dividend Return
Total Return
3 Months
-10.98%
0%
-10.98%
6 Months
10.26%
0%
10.26%
1 Year
-2.37%
0%
-2.37%
2 Years
12.64%
0%
12.64%
3 Years
-82.62%
0%
-82.62%
4 Years
-90.41%
0%
-90.41%
5 Years
0%
0%
0.0%
American Strategic Investment Co. for the last several years.
Risk Adjusted Returns v/s
News
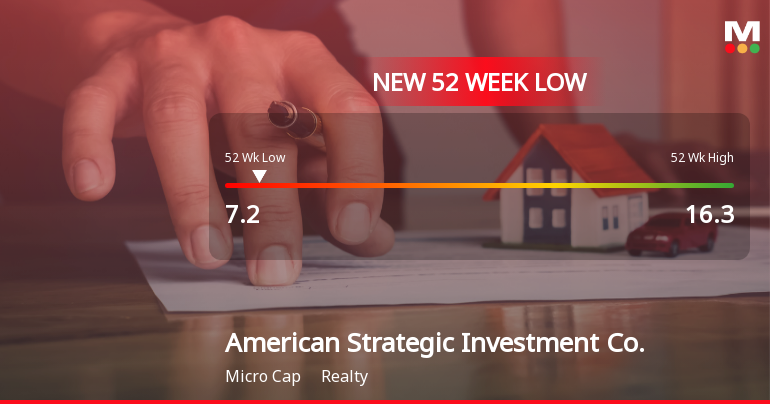
American Strategic Investment Co. Hits New 52-Week Low at $7.20
American Strategic Investment Co., a microcap realty firm, has hit a new 52-week low, reflecting a significant decline in its stock price over the past year. The company faces financial challenges, including negative returns on equity, a high debt-equity ratio, and declining operating profits and cash flow.
Read full news article Announcements

No announcement available
Corporate Actions
No corporate action available
Quality key factors
Factor
Value
Sales Growth (5y)
-4.59%
EBIT Growth (5y)
-12.27%
EBIT to Interest (avg)
-1.13
Debt to EBITDA (avg)
Negative Net Debt
Net Debt to Equity (avg)
0
Sales to Capital Employed (avg)
0
Tax Ratio
0
Dividend Payout Ratio
0
Pledged Shares
0
Institutional Holding
3.77%
ROCE (avg)
0
ROE (avg)
0
Valuation key factors
Factor
Value
P/E Ratio
NA (Loss Making)
Industry P/E
Price to Book Value
0.35
EV to EBIT
-1.14
EV to EBITDA
1.50
EV to Capital Employed
0.18
EV to Sales
0.18
PEG Ratio
NA
Dividend Yield
NA
ROCE (Latest)
-15.54%
ROE (Latest)
-37.66%
Technicals key factors
Indicator
Weekly
Monthly
MACD
Mildly Bullish
Mildly Bullish
RSI
No Signal
No Signal
Bollinger Bands
Mildly Bullish
Bearish
Moving Averages
Mildly Bearish (Daily)
KST
Mildly Bullish
Mildly Bearish
Dow Theory
Mildly Bearish
No Trend
OBV
No Trend
No Trend
 Technical Indicator Scale: Bearish, Mildly Bearish, Sideways, Mildly Bullish, Bullish Turned
 Shareholding Snapshot : Sep 2025
Shareholding Compare (%holding)
Majority shareholders
Domestic Funds
Domestic Funds
Held in 2 Schemes (1.45%)
Foreign Institutions
Held by 0 Foreign Institutions (0%)
Strategic Entities with highest holding
Highest Public shareholder
Quarterly Results Snapshot (Consolidated) - Sep'25 - QoQ
Sep'25
Jun'25
Change(%)
Net Sales
12.30
12.20
0.82%
Operating Profit (PBDIT) excl Other Income
1.90
0.30
533.33%
Interest
7.30
7.80
-6.41%
Exceptional Items
0.00
-30.60
100.00%
Consolidate Net Profit
35.80
-41.70
185.85%
Operating Profit Margin (Excl OI)
-100.40%
-266.70%
16.63%
USD in Million.

Net Sales
QoQ Growth in quarter ended Sep 2025 is 0.82% vs -0.81% in Jun 2025
Consolidated Net Profit
QoQ Growth in quarter ended Sep 2025 is 185.85% vs -384.88% in Jun 2025
Annual Results Snapshot (Consolidated) - Dec'24
Dec'24
Dec'23
Change(%)
Net Sales
61.00
62.70
-2.71%
Operating Profit (PBDIT) excl Other Income
9.40
6.00
56.67%
Interest
19.90
20.40
-2.45%
Exceptional Items
-112.50
-66.60
-68.92%
Consolidate Net Profit
-140.60
-105.90
-32.77%
Operating Profit Margin (Excl OI)
-147.10%
-327.50%
18.04%
USD in Million.

Net Sales
YoY Growth in year ended Dec 2024 is -2.71% vs -1.88% in Dec 2023
Consolidated Net Profit
YoY Growth in year ended Dec 2024 is -32.77% vs -315.29% in Dec 2023
About American Strategic Investment Co.

American Strategic Investment Co.
Realty
New York City REIT, Inc. (the REIT) is a public real estate investment trust that owns a portfolio of commercial real estate located within the five boroughs of New York City, particularly Manhattan. The REIT’s portfolio is diversified across eight office and retail condominium assets located primarily in Manhattan. The REIT invests primarily in properties with 80% or greater occupancy at the time of purchase. The REIT’s portfolio includes 421 W. 54th Street - Hit Factory; 400 E. 67th Street - Laurel Condominium; 200 Riverside Boulevard - ICON Garage; 9 Times Square, 123 William Street; 1140 Avenue of the Americas; 8713 Fifth Avenue, and 196 Orchard Street.
Company Coordinates
Company Details
650 Fifth Ave, 30Th Floor , NEW YORK NY : 10019


Registrar Details
InfinHub Market Technologies FZ-LLC, Building-2, Unit 112, Dubai Internet City, Dubai, United Arab Emirates
GET THE MARKETSMOJO APP


Company
Stocks
Portfolio


"Investment in securities markets are subject to market risk. Read all the related documents carefully before investing."