
Compare Amin Tannery with Similar Stocks
Dashboard
High Debt company with Weak Long Term Fundamental Strength
- Poor long term growth as Net Sales has grown by an annual rate of 5.16% and Operating profit at 6.55% over the last 5 years
- High Debt Company with a Debt to Equity ratio (avg) of 2.30 times
- The company has been able to generate a Return on Equity (avg) of 3.26% signifying low profitability per unit of shareholders funds
Negative results in Mar 26
50.84% of Promoter Shares are Pledged
Consistent Underperformance against the benchmark over the last 3 years
Stock DNA
Diversified consumer products
INR 17 Cr (Micro Cap)
76.00
33
0.00%
2.16
1.69%
1.32
Total Returns (Price + Dividend) 
Amin Tannery for the last several years.
Risk Adjusted Returns v/s
Returns Beta

News
Are Amin Tannery Ltd latest results good or bad?
Amin Tannery Ltd's latest financial results for the quarter ended March 2026 reflect significant operational challenges. The company reported a net profit of ₹0.04 crores, which represents a substantial decline of 63.64% year-on-year. Revenue for the same period was ₹6.13 crores, marking a 36.28% decrease compared to the previous year. This decline in revenue is particularly concerning as it indicates a persistent downward trend, with the latest quarter also showing a 16.60% sequential decline from the previous quarter. The operating margin has compressed to 2.61%, the lowest level in seven quarters, down from 7.69% in the same quarter last year. This compression suggests severe pressures on pricing power and cost management, which the company has been unable to navigate effectively. Additionally, the operating profit, excluding other income, fell dramatically to ₹0.16 crores, a decline of 78.38% year-on-y...
Read full news article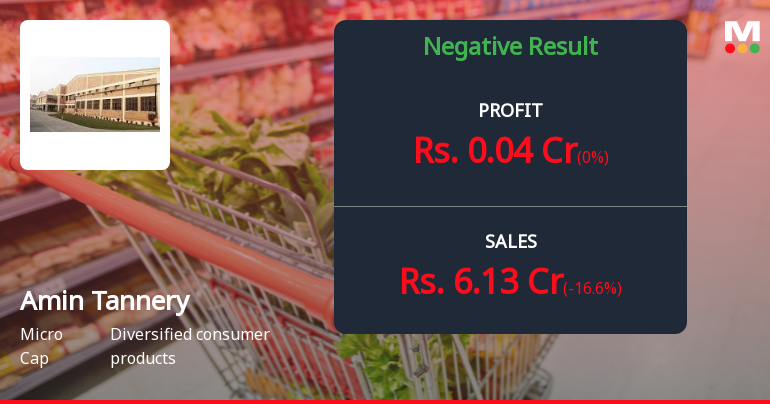
Amin Tannery Q4 FY26: Profitability Collapses Amid Revenue Slump
Amin Tannery Ltd., a micro-cap manufacturer and exporter of finished leather and leather footwear, reported deeply concerning fourth-quarter results for FY26, with net profit plunging to ₹0.04 crores from ₹0.11 crores in the year-ago quarter—a decline of 63.64%. The Kanpur-based company's revenue contracted sharply to ₹6.13 crores in Q4 FY26, down 36.28% year-on-year and 16.60% sequentially, marking the lowest quarterly sales figure in recent periods. With a market capitalisation of just ₹18.00 crores and the stock trading at ₹1.70 as of May 27, 2026, investors are confronting a deteriorating financial trajectory that raises serious questions about the company's operational viability.
Read full news article Announcements
Compliances-Certificate under Reg. 74 (5) of SEBI (DP) Regulations 2018
06-Jul-2026 | Source : BSEAmin Tannery Limited
Closure of Trading Window
24-Jun-2026 | Source : BSEAmin Tannery Limited
Announcement under Regulation 30 (LODR)-Newspaper Publication
27-May-2026 | Source : BSEAmin Tannery Limited
Corporate Actions

No Upcoming Board Meetings

No Dividend history available

No Splits history available

No Bonus history available

No Rights history available
Quality key factors
Valuation key factors
Technicals key factors
 Technical Indicator Scale: Bearish, Mildly Bearish, Sideways, Mildly Bullish, Bullish Turned
 Shareholding Snapshot : Jun 2026
Shareholding Compare (%holding)
Promoters
50.8379
Held by 0 Schemes
Held by 0 FIIs
Veqarul Amin (47.92%)
Crb Capital Markets Limited (2.55%)
34.05%
Quarterly Results Snapshot (Standalone) - Mar'26 - QoQ

QoQ Growth in quarter ended Mar 2026 is -16.60% vs -29.53% in Dec 2025
QoQ Growth in quarter ended Mar 2026 is 0.00% vs -42.86% in Dec 2025
Half Yearly Results Snapshot (Standalone) - Sep'25
Growth in half year ended Sep 2025 is 6.44% vs -17.13% in Sep 2024
Growth in half year ended Sep 2025 is 16.67% vs -33.33% in Sep 2024
Nine Monthly Results Snapshot (Standalone) - Dec'25

YoY Growth in nine months ended Dec 2025 is -10.29% vs -9.62% in Dec 2024
YoY Growth in nine months ended Dec 2025 is 0.00% vs -21.74% in Dec 2024
Annual Results Snapshot (Standalone) - Mar'26
YoY Growth in year ended Mar 2026 is -16.33% vs -11.68% in Mar 2025
YoY Growth in year ended Mar 2026 is -24.14% vs -19.44% in Mar 2025
About Amin Tannery Ltd

Company Coordinates


