
Compare Amines & Plast. with Similar Stocks
Dashboard
Strong ability to service debt as the company has a low Debt to EBITDA ratio of 0.46 times
Poor long term growth as Net Sales has grown by an annual rate of 5.26% and Operating profit at 2.13% over the last 5 years
The company has declared positive results in Mar'2026 after 2 consecutive negative quarters
With ROE of 12.5, it has a Expensive valuation with a 3.6 Price to Book Value
Despite the size of the company, domestic mutual funds hold only 0% of the company
Underperformed the market in the last 1 year
Stock DNA
Commodity Chemicals
INR 1,074 Cr (Micro Cap)
29.00
47
0.26%
-0.09
12.50%
3.65
Total Returns (Price + Dividend) 
Latest dividend: 0.5 per share ex-dividend date: Sep-12-2025
Risk Adjusted Returns v/s
Returns Beta

News
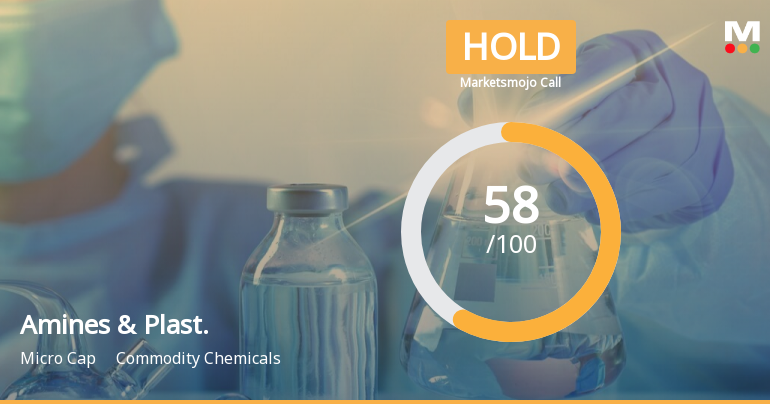
Amines & Plasticizers Ltd is Rated Hold by MarketsMOJO
Amines & Plasticizers Ltd is rated 'Hold' by MarketsMOJO, with this rating last updated on 03 July 2026. However, the analysis and financial metrics discussed here reflect the company’s current position as of 17 July 2026, providing investors with the most recent insights into its performance and outlook.
Read full news article
Amines & Plasticizers Ltd Technical Momentum Shifts Amid Mixed Market Signals
Amines & Plasticizers Ltd, a micro-cap player in the commodity chemicals sector, has experienced a nuanced shift in its technical momentum, moving from a bullish to a mildly bullish stance. Despite a slight dip in daily price, the stock’s technical indicators present a complex picture, with weekly and monthly signals diverging and the company’s recent upgrade to a Hold rating reflecting this evolving outlook.
Read full news article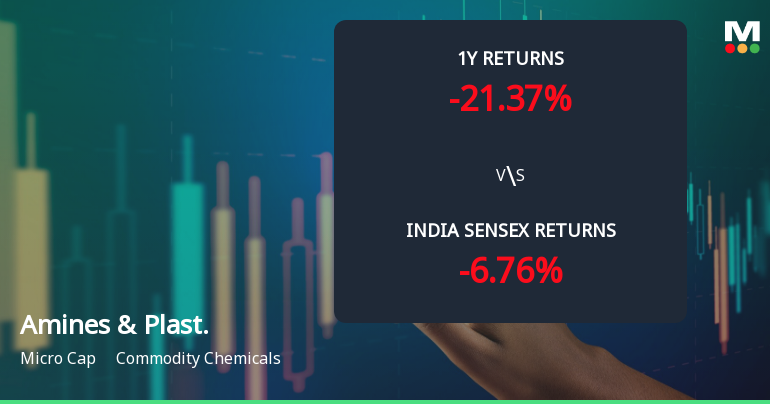
Amines & Plasticizers Ltd Technical Momentum Shifts Signal Bullish Outlook
Amines & Plasticizers Ltd has witnessed a notable shift in its technical momentum, moving from a mildly bullish stance to a more confident bullish trend. This transition is underscored by mixed signals from key technical indicators such as MACD, RSI, moving averages, and Bollinger Bands, reflecting a nuanced market sentiment amid the commodity chemicals sector. Despite a recent day decline of 2.10%, the stock’s longer-term technical and fundamental metrics suggest a cautiously optimistic outlook for investors.
Read full news article Announcements
Corporate Actions

No Upcoming Board Meetings

Amines & Plasticizers Ltd has declared 25% dividend, ex-date: 12 Sep 25

Amines & Plasticizers Ltd has announced 2:10 stock split, ex-date: 27 Feb 15

Amines & Plasticizers Ltd has announced 1:1 bonus issue, ex-date: 08 Oct 15

No Rights history available
Quality key factors
Valuation key factors
Technicals key factors
 Technical Indicator Scale: Bearish, Mildly Bearish, Sideways, Mildly Bullish, Bullish Turned
 Shareholding Snapshot : Mar 2026
Shareholding Compare (%holding)
Promoters
None
Held by 0 Schemes
Held by 0 FIIs
Hemant Kumar Ruia (39.98%)
India Carbon Limited (12.7%)
9.31%
Quarterly Results Snapshot (Consolidated) - Mar'26 - QoQ

QoQ Growth in quarter ended Mar 2026 is 8.90% vs 7.00% in Dec 2025
QoQ Growth in quarter ended Mar 2026 is 102.51% vs 22.85% in Dec 2025
Half Yearly Results Snapshot (Consolidated) - Sep'25

Growth in half year ended Sep 2025 is -10.09% vs 3.31% in Sep 2024
Growth in half year ended Sep 2025 is -26.25% vs 8.41% in Sep 2024
Nine Monthly Results Snapshot (Consolidated) - Dec'25
YoY Growth in nine months ended Dec 2025 is -15.97% vs 5.38% in Dec 2024
YoY Growth in nine months ended Dec 2025 is -24.89% vs 4.87% in Dec 2024
Annual Results Snapshot (Consolidated) - Mar'26
YoY Growth in year ended Mar 2026 is -13.58% vs 2.12% in Mar 2025
YoY Growth in year ended Mar 2026 is -10.90% vs 2.94% in Mar 2025
About Amines & Plasticizers Ltd

Company Coordinates


