
Compare A C J K Exports with Similar Stocks
Stock DNA
Other Agricultural Products
INR 1,232 Cr (Small Cap)
13.00
21
0.00%
0.58
8.87%
1.45
Total Returns (Price + Dividend) 

Risk Adjusted Returns v/s
Returns Beta
News

Amir Chand Jagdish Kumar (Exports) Ltd Downgraded to Sell Amid Technical Weakness and Earnings Pressure
Amir Chand Jagdish Kumar (Exports) Ltd, a small-cap player in the Other Agricultural Products sector, has seen its investment rating downgraded from Hold to Sell as of 2 June 2026. The revision reflects a combination of deteriorating technical indicators, disappointing quarterly earnings, and a cautious outlook on valuation and financial trends, signalling increased risk for investors amid a challenging market environment.
Read full news article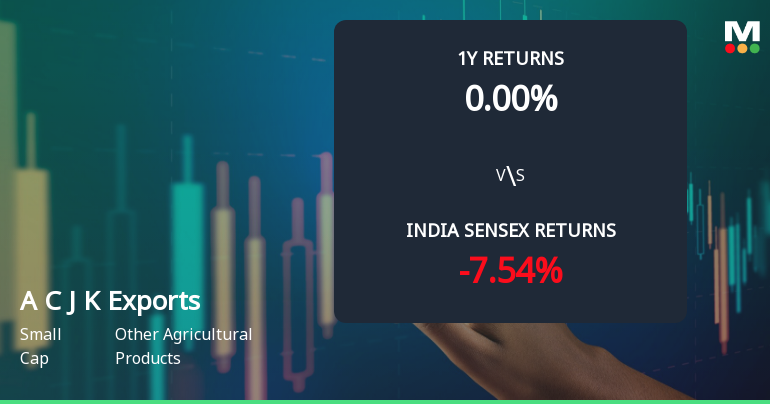
Amir Chand Jagdish Kumar (Exports) Ltd Faces Mildly Bearish Momentum Amid Technical Downgrade
Amir Chand Jagdish Kumar (Exports) Ltd, a small-cap player in the Other Agricultural Products sector, has experienced a notable shift in price momentum, reflected in a downgrade from Hold to Sell by MarketsMOJO on 2 June 2026. The stock’s technical indicators signal a transition from a sideways trend to a mildly bearish outlook, with key metrics such as MACD, RSI, and moving averages pointing to increased selling pressure amid a 2.75% decline in daily price.
Read full news article
Amir Chand Jagdish Kumar (Exports) Ltd Technical Momentum Shifts Amid Sideways Trend
Amir Chand Jagdish Kumar (Exports) Ltd, a small-cap player in the Other Agricultural Products sector, has experienced a notable shift in its technical momentum, moving from a mildly bullish stance to a sideways trend. This transition is underscored by mixed signals from key technical indicators such as MACD, RSI, and moving averages, reflecting a period of consolidation after recent price fluctuations.
Read full news article Announcements
Corporate Actions

No Upcoming Board Meetings

No Dividend history available

No Splits history available

No Bonus history available

No Rights history available
Quality key factors
Valuation key factors
Technicals key factors
 Technical Indicator Scale: Bearish, Mildly Bearish, Sideways, Mildly Bullish, Bullish Turned
 Shareholding Snapshot : Apr 2026
Shareholding Compare (%holding)
Promoters
None
Held by 0 Schemes
Held by 12 FIIs (3.5%)
Jagdish Kumar Suri (71.56%)
Rajasthan Global Securities Private Limited (2.02%)
9.85%
Quarterly Results Snapshot (Standalone) - Mar'26 - QoQ

QoQ Growth in quarter ended Mar 2026 is 26.28% vs -0.23% in Dec 2025

QoQ Growth in quarter ended Mar 2026 is -53.80% vs 14.08% in Dec 2025
Annual Results Snapshot (Consolidated) - Mar'26
YoY Growth in year ended Mar 2026 is 14.26% vs 29.18% in Mar 2025
YoY Growth in year ended Mar 2026 is 69.85% vs 97.66% in Mar 2025
About Amir Chand Jagdish Kumar (Exports) Ltd

Company Coordinates


