
Compare Amrapali Inds. with Similar Stocks
Dashboard
High Debt company with Weak Long Term Fundamental Strength
- High Debt Company with a Debt to Equity ratio (avg) of 2.50 times
- The company has been able to generate a Return on Capital Employed (avg) of 5.17% signifying low profitability per unit of total capital (equity and debt)
With a growth in Operating Profit of 2772.86%, the company declared Outstanding results in Mar 26
With ROCE of 9.5, it has a Attractive valuation with a 1.6 Enterprise value to Capital Employed
Increasing Participation by Institutional Investors
Stock DNA
Trading & Distributors
INR 163 Cr (Micro Cap)
14.00
21
0.00%
3.88
27.48%
3.76
Total Returns (Price + Dividend) 
Amrapali Inds. for the last several years.
Risk Adjusted Returns v/s
Returns Beta

News
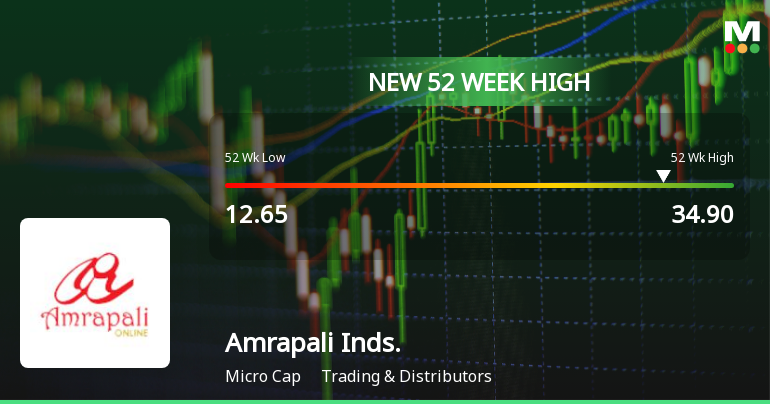
Broad-Based Technical Strength Lifts Amrapali Industries Ltd to 52-Week High of Rs 34.9
Surging past its previous peaks, Amrapali Industries Ltd reached a fresh 52-week high of Rs 34.9 on 12 Jun 2026, marking a remarkable 101.6% gain over the past year despite a broader market that has struggled to maintain momentum.
Read full news article

Broad-Based Technical Strength Lifts Amrapali Industries Ltd to 52-Week High of Rs 33.42
Surging past its previous peaks, Amrapali Industries Ltd touched a fresh 52-week high of Rs 33.42 on 11 Jun 2026, marking a remarkable rally that has seen the stock gain over 75% in just four trading sessions. This milestone comes amid a broader market environment where the Sensex is struggling near its 52-week lows, underscoring the stock’s distinctive momentum.
Read full news article Announcements
Announcement under Regulation 30 (LODR)-Newspaper Publication
05-Jun-2026 | Source : BSENewspaper Advertisement
Announcement under Regulation 30 (LODR)-Newspaper Publication
05-Jun-2026 | Source : BSENewspaper Advertisement
Board Meeting Outcome for Board Meeting Outcom
30-May-2026 | Source : BSEBoard Meeting Outcome
Corporate Actions

No Upcoming Board Meetings

No Dividend history available

Amrapali Industries Ltd has announced 5:10 stock split, ex-date: 27 Jan 11

No Bonus history available

No Rights history available
Quality key factors
Valuation key factors
Technicals key factors
 Technical Indicator Scale: Bearish, Mildly Bearish, Sideways, Mildly Bullish, Bullish Turned
 Shareholding Snapshot : Mar 2026
Shareholding Compare (%holding)
Promoters
None
Held by 0 Schemes
Held by 3 FIIs (0.81%)
Yashwant Amratlal Thakkar (50.34%)
Ashokkumar Sunderdas Vaswani (2.43%)
23.2%
Quarterly Results Snapshot (Consolidated) - Mar'26 - YoY

YoY Growth in quarter ended Mar 2026 is 453.79% vs -36.75% in Mar 2025

YoY Growth in quarter ended Mar 2026 is 775.00% vs 3,233.33% in Mar 2025
Half Yearly Results Snapshot (Consolidated) - Sep'25
Growth in half year ended Sep 2025 is 40.62% vs -20.04% in Sep 2024
Growth in half year ended Sep 2025 is 102.78% vs -26.53% in Sep 2024
Nine Monthly Results Snapshot (Consolidated) - Dec'25
YoY Growth in nine months ended Dec 2025 is 35.58% vs 1.21% in Dec 2024
YoY Growth in nine months ended Dec 2025 is 501.59% vs -3.08% in Dec 2024
Annual Results Snapshot (Consolidated) - Mar'26
YoY Growth in year ended Mar 2026 is 88.56% vs -5.95% in Mar 2025
YoY Growth in year ended Mar 2026 is 656.97% vs 83.33% in Mar 2025
About Amrapali Industries Ltd

Company Coordinates


