
Compare Analog Devices, Inc. with Similar Stocks
Dashboard
Strong ability to service debt as the company has a low Debt to EBITDA ratio of 1.12 times
Healthy long term growth as Net Sales has grown by an annual rate of 13.48% and Operating profit at 12.33%
Positive results in Jul 25
High Institutional Holdings at 91.93%
Market Beating Performance
Stock DNA
Other Electrical Equipment
USD 149,330 Million (Large Cap)
58.00
NA
1.33%
0.15
6.89%
4.42
Total Returns (Price + Dividend) 
Analog Devices, Inc. for the last several years.
Risk Adjusted Returns v/s
News

Analog Devices Hits Day High with 3.05% Surge, Outperforming S&P 500
Analog Devices, Inc. has shown strong stock performance, with notable gains over the past week and year. The company maintains a solid financial position, characterized by a low Debt to EBITDA ratio and healthy long-term growth in net sales. High institutional holdings reflect investor confidence in its fundamentals.
Read full news article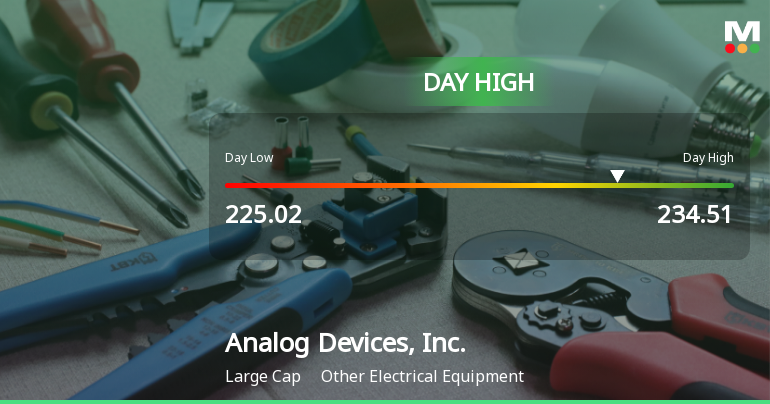
Analog Devices Hits Day High with 3.16% Surge in Stock Price
Analog Devices, Inc. has seen a daily increase, contrasting with a modest rise in the S&P 500. Despite recent gains, the company has experienced declines over the past week and month. It maintains a solid financial position with a low Debt to EBITDA ratio and high institutional holdings.
Read full news article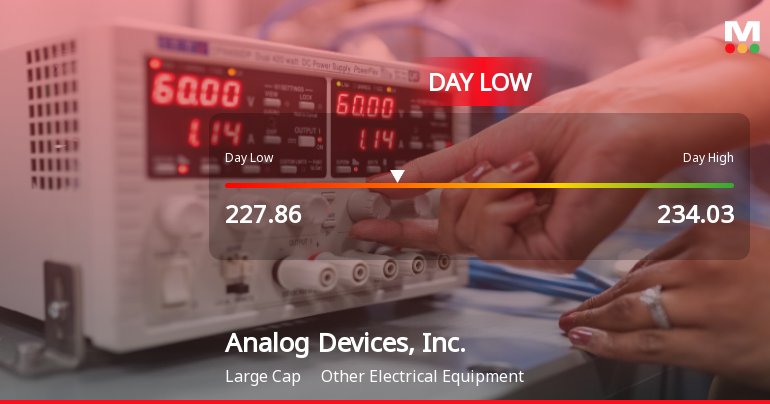
Analog Devices Hits Day Low of $227.85 Amid 3.2% Decline
Analog Devices, Inc. saw a decline in stock value today, contrasting with a slight decrease in the S&P 500. Despite recent fluctuations, the company has shown long-term growth with a significant annual increase in net sales and maintains a strong financial position with low debt levels.
Read full news article Announcements

Corporate Actions
Quality key factors
Valuation key factors
Technicals key factors
 Technical Indicator Scale: Bearish, Mildly Bearish, Sideways, Mildly Bullish, Bullish Turned
 Shareholding Snapshot : Oct 2025
Shareholding Compare (%holding)
Domestic Funds
Held in 212 Schemes (36.61%)
Held by 535 Foreign Institutions (22.45%)
Quarterly Results Snapshot (Consolidated) - Oct'25 - QoQ

QoQ Growth in quarter ended Oct 2025 is 6.80% vs 9.10% in Jul 2025

QoQ Growth in quarter ended Oct 2025 is 51.92% vs -9.00% in Jul 2025
Annual Results Snapshot (Consolidated) - Oct'25
YoY Growth in year ended Oct 2025 is 16.89% vs -23.39% in Oct 2024
YoY Growth in year ended Oct 2025 is 38.65% vs -50.66% in Oct 2024
About Analog Devices, Inc.

Company Coordinates


