
Compare Anand Rathi Shar with Similar Stocks
Dashboard
Strong Long Term Fundamental Strength with an average Return on Equity (ROE) of 0%
With a growth in Net Profit of 10.88%, the company declared Very Positive results in Mar 26
With ROE of 9.7, it has a Attractive valuation with a 2.4 Price to Book Value
Falling Participation by Institutional Investors
Stock DNA
Capital Markets
INR 3,265 Cr (Small Cap)
25.00
20
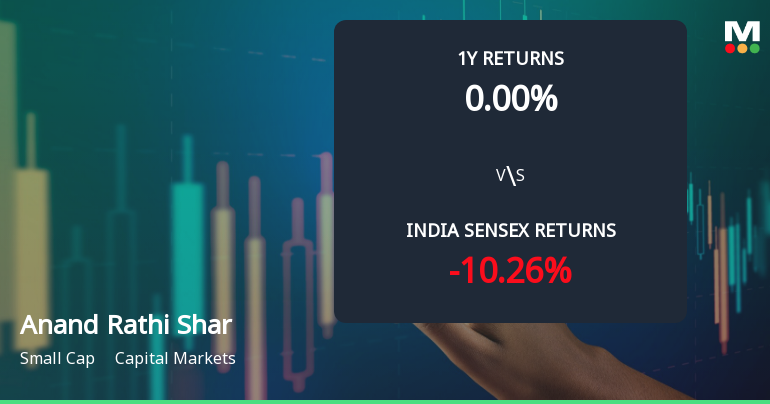
0.00%
0.62
9.74%
2.45
Total Returns (Price + Dividend) 
Anand Rathi Shar for the last several years.
Risk Adjusted Returns v/s
Returns Beta

News
Anand Rathi Share & Stock Brokers Ltd Technical Momentum Shifts Amid Market Pressure
Anand Rathi Share & Stock Brokers Ltd has experienced a notable shift in its technical momentum, transitioning from a sideways trend to a mildly bullish stance on weekly charts despite recent price declines. This nuanced change in technical indicators, including MACD, RSI, and moving averages, offers a complex picture for investors navigating the capital markets sector amid broader market headwinds.
Read full news article
Anand Rathi Share & Stock Brokers Ltd Technical Momentum Shifts to Mildly Bullish
Anand Rathi Share & Stock Brokers Ltd has experienced a notable shift in its technical momentum, moving from a sideways trend to a mildly bullish stance. This change is underscored by improvements in key technical indicators such as the MACD and Dow Theory signals on the weekly chart, despite some mixed signals from other metrics. Investors and analysts are now closely monitoring these developments amid a challenging market backdrop and a recent downgrade in the company’s rating from Hold to Buy by MarketsMOJO.
Read full news article
Anand Rathi Share & Stock Brokers Ltd is Rated Buy
Anand Rathi Share & Stock Brokers Ltd is rated Buy by MarketsMOJO, with this rating last updated on 25 May 2026. While the rating change occurred on that date, the analysis and financial metrics discussed here reflect the stock’s current position as of 29 May 2026, providing investors with the most up-to-date view of the company’s fundamentals, valuation, financial trends, and technical outlook.
Read full news article Announcements
Announcement under Regulation 30 (LODR)-Newspaper Publication
05-Jun-2026 | Source : BSESubmission of Newspaper Advertisement for 35th AGM (Pre Intimation) of the Company
Announcement under Regulation 30 (LODR)-Credit Rating
05-Jun-2026 | Source : BSEIntimation Regarding withdrawl of Credit Rating of the Company by CRISIL Rating Limited
Disclosures of reasons for encumbrance by promoter of listed companies under Reg. 31(1) read with Regulation 28(3) of SEBI (SAST) Regulations 2011.
03-Jun-2026 | Source : BSEThe Exchange has received the Disclosures of reasons for encumbrance by promoter of listed companies under Reg. 31(1) read with Regulation 28(3) of SEBI (SAST) Regulations 2011 on June 03 2026 for Anand Rathi Financial Services Ltd
Corporate Actions

No Upcoming Board Meetings

No Dividend history available

No Splits history available

No Bonus history available

No Rights history available
Quality key factors
Valuation key factors
Technicals key factors
 Technical Indicator Scale: Bearish, Mildly Bearish, Sideways, Mildly Bullish, Bullish Turned
 Shareholding Snapshot : Mar 2026
Shareholding Compare (%holding)
Promoters
5.472
Held by 3 Schemes (2.4%)
Held by 10 FIIs (0.82%)
Anand Rathi Financial Services Limited (69.9%)
Sbi Life Insurance Co. Ltd (1.17%)
19.02%
Quarterly Results Snapshot (Standalone) - Mar'26 - QoQ

QoQ Growth in quarter ended Mar 2026 is 2.90% vs 9.25% in Dec 2025
QoQ Growth in quarter ended Mar 2026 is 10.88% vs 32.46% in Dec 2025
Half Yearly Results Snapshot (Standalone) - Sep'25
Not Applicable: The company has declared_date for only one period
Not Applicable: The company has declared_date for only one period
Nine Monthly Results Snapshot (Standalone) - Dec'25
Not Applicable: The company has declared_date for only one period
Not Applicable: The company has declared_date for only one period
Annual Results Snapshot (Standalone) - Mar'26
Not Applicable: The company has declared_date for only one period
Not Applicable: The company has declared_date for only one period
About Anand Rathi Share & Stock Brokers Ltd

Company Coordinates


