
Compare Anand Rayons with Similar Stocks
Stock DNA
Garments & Apparels
INR 114 Cr (Micro Cap)
12.00
23
0.00%
0.02
9.98%
1.18
Total Returns (Price + Dividend) 
Latest dividend: 0.5 per share ex-dividend date: Sep-20-2019
Risk Adjusted Returns v/s
Returns Beta

News

Anand Rayons Ltd is Rated Sell
Anand Rayons Ltd is rated Sell by MarketsMOJO. This rating was last updated on 27 May 2026, reflecting a shift from a previous 'Strong Sell' stance. However, the analysis and financial metrics discussed here represent the stock's current position as of 16 June 2026, providing investors with an up-to-date view of the company’s performance and outlook.
Read full news article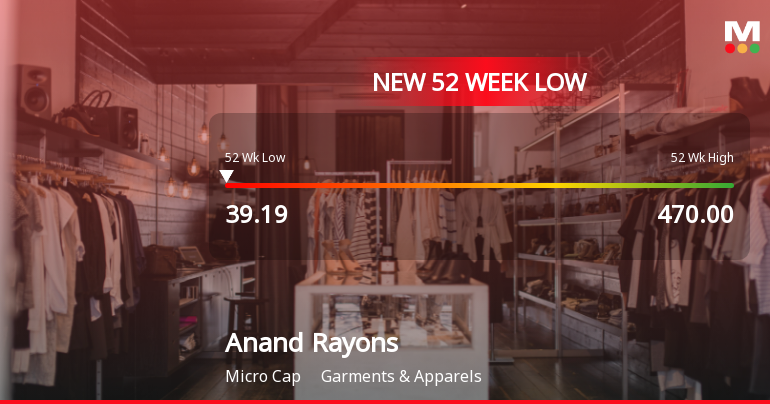
Anand Rayons Ltd Falls to 52-Week Low of Rs 39.19 as Sell-Off Deepens
For the fifth consecutive session, Anand Rayons Ltd closed lower, breaching its 52-week low at Rs 39.19 on 09 Jun 2026. This marks a sharp decline of 17.03% over the past five days, underscoring persistent selling pressure despite some positive financial indicators.
Read full news article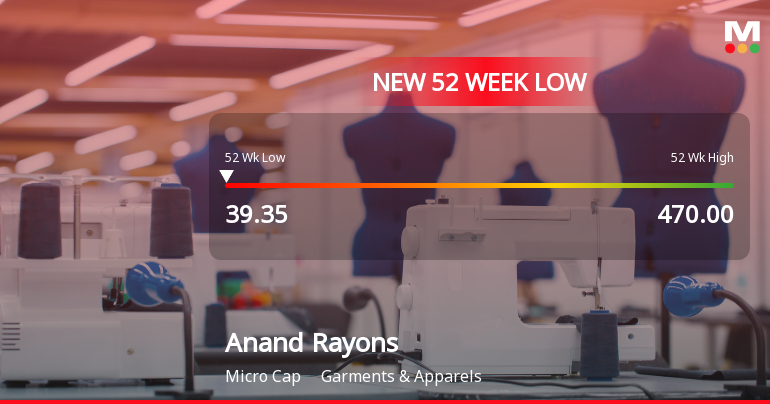
Anand Rayons Ltd Falls to 52-Week Low of Rs 39.35 as Sell-Off Deepens
For the fourth consecutive session, Anand Rayons Ltd has closed lower, culminating in a fresh 52-week low of Rs 39.35 on 8 Jun 2026. This marks a steep decline of 17.07% over the past four days, underscoring persistent selling pressure despite some positive financial signals.
Read full news article Announcements
Board Meeting Outcome for Outcome Of Board Meeting Dated 18.06.2026
18-Jun-2026 | Source : BSEOutcome of Board meeting
Price Clarification
17-Jun-2026 | Source : BSEClarification on price movement of company
Clarification sought from Anand Rayons Ltd
16-Jun-2026 | Source : BSEThe Exchange has sought clarification from Anand Rayons Ltd on June 16 2026 with reference to significant movement in price in order to ensure that investors have latest relevant information about the company and to inform the market so that the interest of the investors is safeguarded.
The reply is awaited.
Corporate Actions

No Upcoming Board Meetings

Anand Rayons Ltd has declared 5% dividend, ex-date: 20 Sep 19

No Splits history available

No Bonus history available

No Rights history available
Quality key factors
Valuation key factors
Technicals key factors
 Technical Indicator Scale: Bearish, Mildly Bearish, Sideways, Mildly Bullish, Bullish Turned
 Shareholding Snapshot : Mar 2026
Shareholding Compare (%holding)
Promoters
None
Held by 0 Schemes
Held by 0 FIIs
Anand Gokulbhai Bakshi (26.64%)
Lalitkumar Manikchand Daga (1.12%)
41.13%
Quarterly Results Snapshot (Standalone) - Mar'26 - QoQ

QoQ Growth in quarter ended Mar 2026 is -6.76% vs 12.84% in Dec 2025
QoQ Growth in quarter ended Mar 2026 is -43.33% vs 200.00% in Dec 2025
Half Yearly Results Snapshot (Standalone) - Sep'25

Growth in half year ended Sep 2025 is 22.81% vs -3.15% in Sep 2024
Growth in half year ended Sep 2025 is 68.55% vs 0.00% in Sep 2024
Nine Monthly Results Snapshot (Standalone) - Dec'25
YoY Growth in nine months ended Dec 2025 is 38.17% vs -8.42% in Dec 2024
YoY Growth in nine months ended Dec 2025 is 199.17% vs 3.45% in Dec 2024
Annual Results Snapshot (Standalone) - Mar'26
YoY Growth in year ended Mar 2026 is 38.00% vs -8.86% in Mar 2025
YoY Growth in year ended Mar 2026 is 108.93% vs 10.86% in Mar 2025
About Anand Rayons Ltd

Company Coordinates


