
Compare Anand Rayons with Similar Stocks
Stock DNA
Garments & Apparels
INR 116 Cr (Micro Cap)
12.00
23
0.00%
0.02
9.98%
1.21
Total Returns (Price + Dividend) 
Latest dividend: 0.5 per share ex-dividend date: Sep-20-2019
Risk Adjusted Returns v/s
Returns Beta

News

Anand Rayons Ltd is Rated Sell
Anand Rayons Ltd is rated Sell by MarketsMOJO. This rating was last updated on 27 May 2026, reflecting a shift from a previous 'Strong Sell' stance. However, the analysis and financial metrics discussed here represent the stock's current position as of 16 June 2026, providing investors with an up-to-date view of the company’s performance and outlook.
Read full news article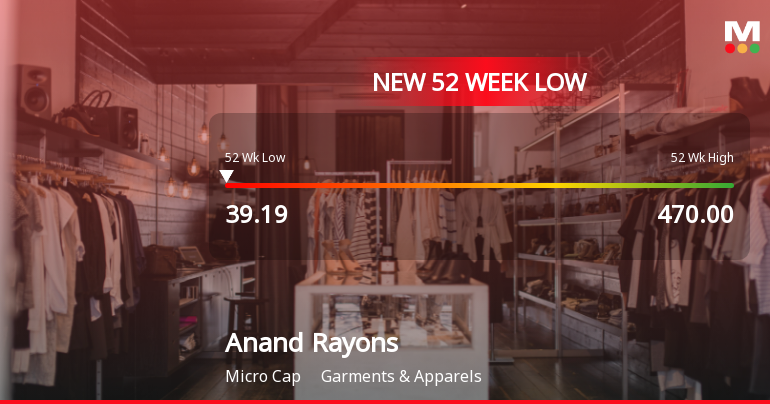
Anand Rayons Ltd Falls to 52-Week Low of Rs 39.19 as Sell-Off Deepens
For the fifth consecutive session, Anand Rayons Ltd closed lower, breaching its 52-week low at Rs 39.19 on 09 Jun 2026. This marks a sharp decline of 17.03% over the past five days, underscoring persistent selling pressure despite some positive financial indicators.
Read full news article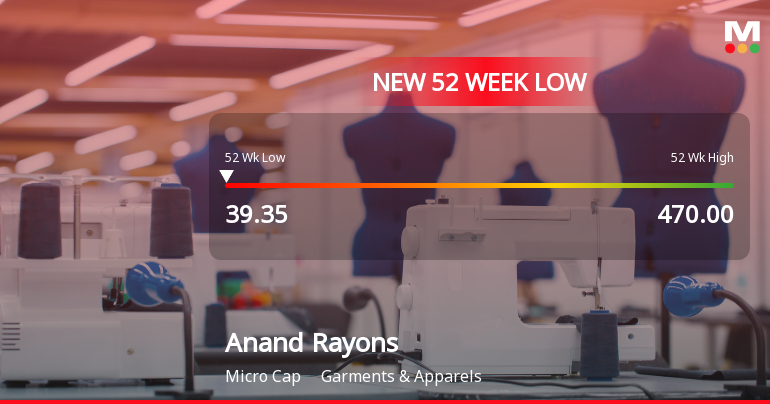
Anand Rayons Ltd Falls to 52-Week Low of Rs 39.35 as Sell-Off Deepens
For the fourth consecutive session, Anand Rayons Ltd has closed lower, culminating in a fresh 52-week low of Rs 39.35 on 8 Jun 2026. This marks a steep decline of 17.07% over the past four days, underscoring persistent selling pressure despite some positive financial signals.
Read full news article Announcements
Closure of Trading Window
20-Jun-2026 | Source : BSEAs per SEBI (PIT) Regulations 2015 Trading window will be closed from 01/07/2026 for the purpose of financial results for the quarter ended 30/06/2026
Board Meeting Outcome for Outcome Of Board Meeting Dated 18.06.2026
18-Jun-2026 | Source : BSEOutcome of Board meeting
Price Clarification
17-Jun-2026 | Source : BSEClarification on price movement of company
Corporate Actions

No Upcoming Board Meetings

Anand Rayons Ltd has declared 5% dividend, ex-date: 20 Sep 19

No Splits history available

No Bonus history available

No Rights history available
Quality key factors
Valuation key factors
Technicals key factors
 Technical Indicator Scale: Bearish, Mildly Bearish, Sideways, Mildly Bullish, Bullish Turned
 Shareholding Snapshot : Mar 2026
Shareholding Compare (%holding)
Promoters
None
Held by 0 Schemes
Held by 0 FIIs
Anand Gokulbhai Bakshi (26.64%)
Lalitkumar Manikchand Daga (1.12%)
41.13%
Quarterly Results Snapshot (Standalone) - Mar'26 - QoQ

QoQ Growth in quarter ended Mar 2026 is -6.76% vs 12.84% in Dec 2025
QoQ Growth in quarter ended Mar 2026 is -43.33% vs 200.00% in Dec 2025
Half Yearly Results Snapshot (Standalone) - Sep'25

Growth in half year ended Sep 2025 is 22.81% vs -3.15% in Sep 2024
Growth in half year ended Sep 2025 is 68.55% vs 0.00% in Sep 2024
Nine Monthly Results Snapshot (Standalone) - Dec'25
YoY Growth in nine months ended Dec 2025 is 38.17% vs -8.42% in Dec 2024
YoY Growth in nine months ended Dec 2025 is 199.17% vs 3.45% in Dec 2024
Annual Results Snapshot (Standalone) - Mar'26
YoY Growth in year ended Mar 2026 is 38.00% vs -8.86% in Mar 2025
YoY Growth in year ended Mar 2026 is 108.93% vs 10.86% in Mar 2025
About Anand Rayons Ltd

Company Coordinates


